Please select the platform to login


Designing an effective store layout isn’t just about aesthetics, but it’s about understanding how visitors interact with your website. Heatmaps are one of the most powerful tools for this purpose. They give you a visual representation of where users click, scroll, and spend the most time, helping you optimize layout, navigation, and product placement for maximum conversions. Here’s how to use heatmaps to analyze behavior and enhance your store’s performance.

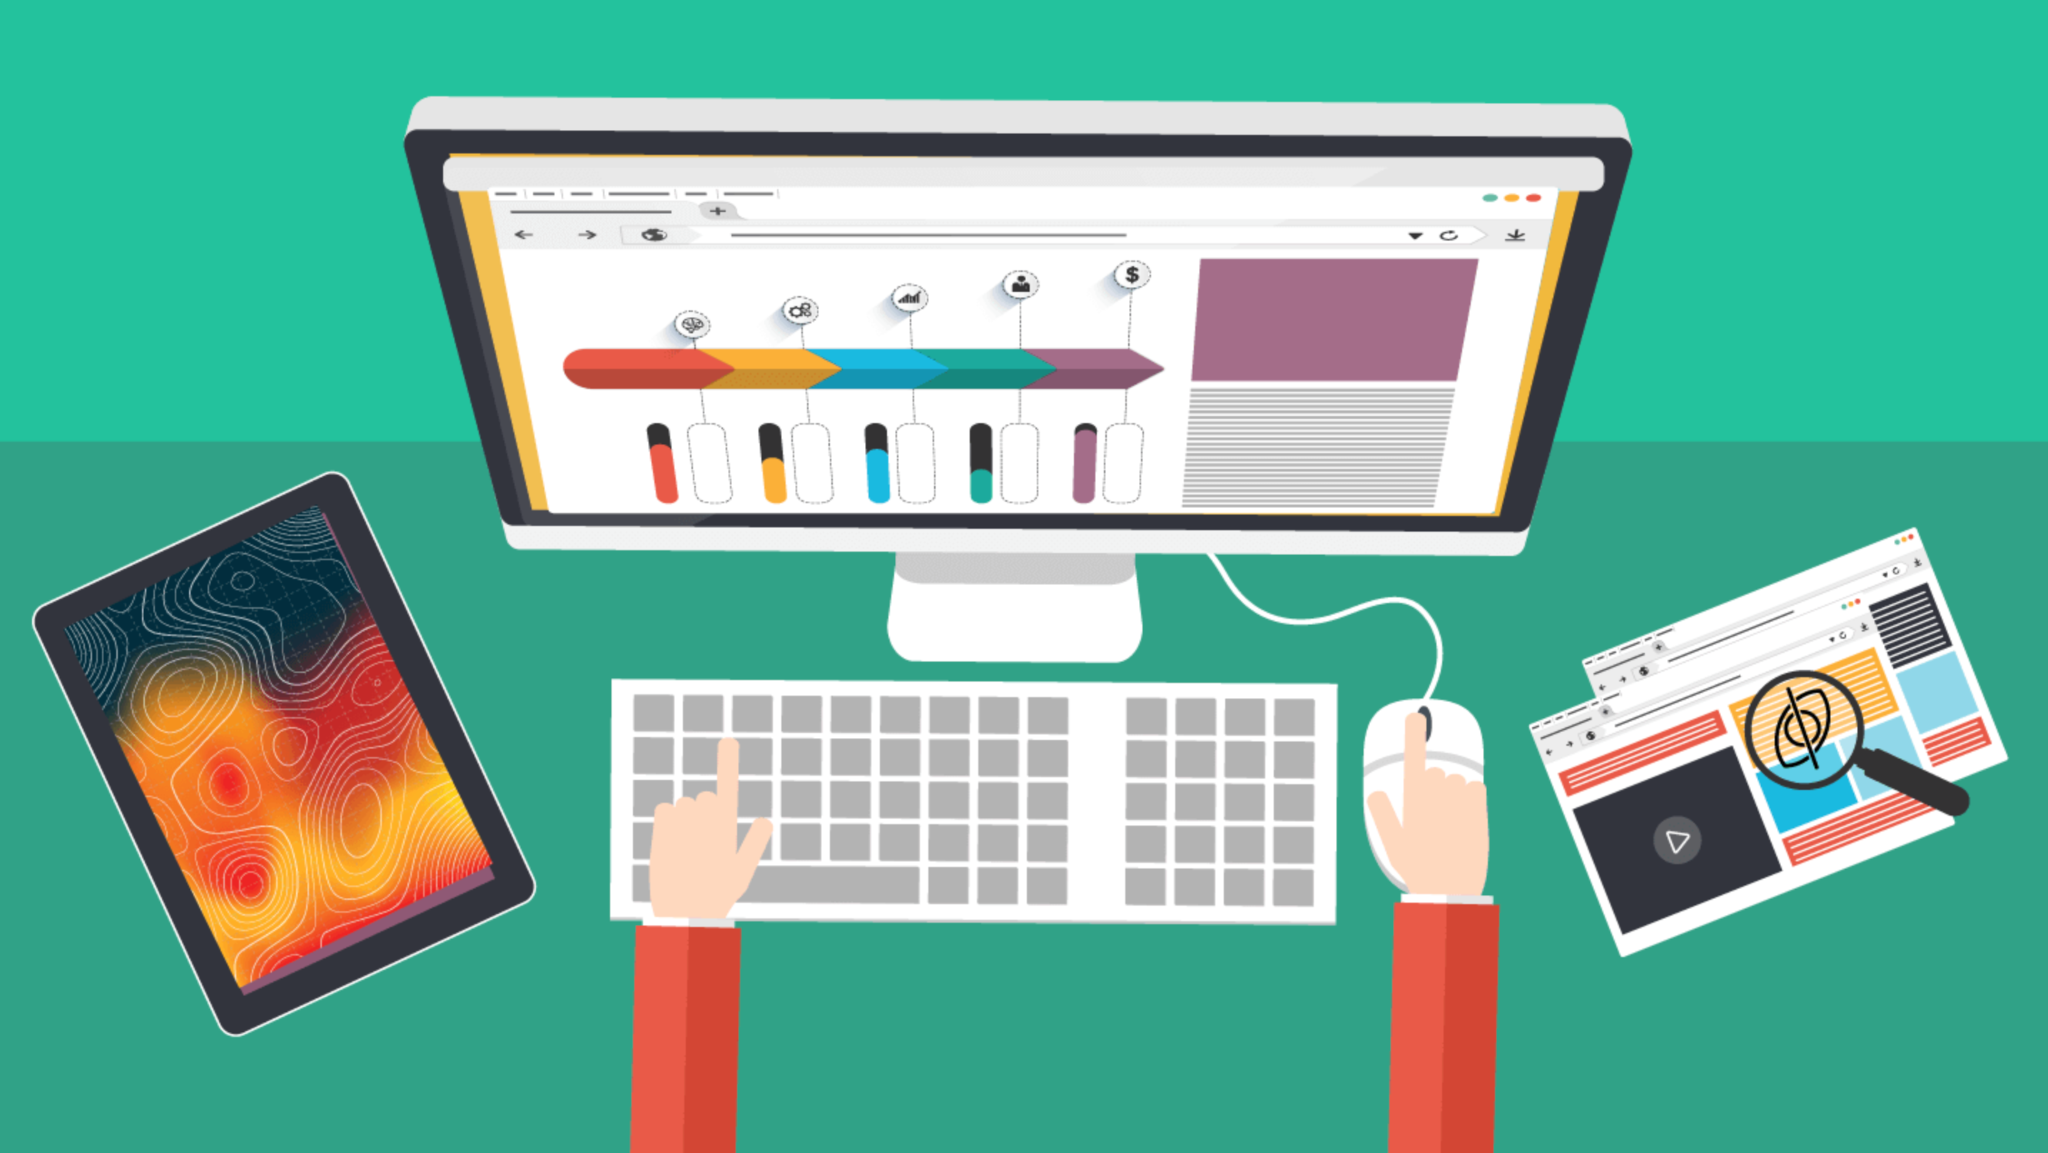
A heatmap is a visual tool that uses color gradients to show where visitors focus their attention on your website. Hot areas (red or orange) indicate high engagement, while cooler areas (blue or green) show low interaction.
By analyzing this data, you can uncover user patterns that traditional analytics may overlook. For eCommerce store owners, this means identifying which products attract attention, where customers drop off, and which design elements encourage clicks.
Benefits of using heatmaps:
Before applying insights, you should know the main types of heatmaps and what they reveal about your store layout.

These show where users click most often. They highlight which buttons, banners, and product images are driving interaction.
If visitors frequently click on non-clickable areas, it may indicate confusion in your layout or misleading design cues.
How to use:
Scroll heatmaps show how far users scroll down your pages. This helps you understand whether important information or products are placed too low on the page.
How to use:
Move heatmaps track where users move their mouse, often reflecting where their eyes are drawn. This can reveal visual hierarchy effectiveness.
How to use:
Once you’ve collected heatmap data, the real value comes from how you interpret and apply it. Heatmaps don’t just tell you what users are doing, they reveal why they behave a certain way. By analyzing these insights, you can refine your layout to make navigation smoother, content more engaging, and product visibility stronger. Below are detailed strategies on how to turn heatmap findings into impactful layout improvements.
If your heatmaps indicate users frequently clicking on navigation elements or spending too much time hovering around the top menu, it may mean they’re struggling to locate specific pages. A confusing or crowded navigation system can cause visitors to leave prematurely. Simplify your structure by reducing the number of top-level categories and grouping related products under clear submenus.
Also, ensure that the most visited sections, like “Shop All,” “New Arrivals,” or “Sale”, are positioned in hot zones with clear labeling. Use consistent styling for menu links to maintain a predictable experience. A smooth, intuitive navigation layout helps users find products faster and encourages them to explore more pages, increasing average session duration and conversion opportunities.
Enhance Product Placement
Heatmaps can show which areas of a page draw the most attention, guiding you to place your best products where users naturally look first. For instance, if the upper-left or center section receives the most clicks or hovers, feature top-selling, trending, or seasonal items there.
You can also use these insights to improve your collection pages, placing popular categories or bundles in high-engagement zones. Similarly, if certain areas show low activity, consider moving less important content there or rethinking how products are visually presented. Strategic product placement ensures that every inch of your store layout works toward higher visibility and conversions.
Call-to-action buttons (CTAs) are critical for guiding shoppers toward making a purchase, signing up, or adding items to their cart. Heatmaps help you see if users are actually noticing and interacting with them. If your “Add to Cart” or “Buy Now” buttons appear in cooler zones, they may be poorly placed or lack contrast.
Experiment with positioning CTAs near hot areas such as high-engagement product images or pricing information. Use visual hierarchy, color contrast, whitespace, and button size—to draw the eye. Test different wording too; for example, “Get Yours Now” might perform better than “Shop Here.” Over time, small design adjustments informed by heatmap data can significantly boost click-through and conversion rates.
Sometimes heatmaps reveal users clicking on irrelevant elements like decorative banners, background images, or icons that aren’t linked to anything. These “false targets” distract from your conversion goals and create frustration. Use this insight to simplify your design by minimizing unnecessary visuals and focusing attention on core actions.
Keep your layout clean and structured, ensuring there’s a clear path from browsing to purchase. Strategic use of whitespace can also help highlight key elements and make your pages easier to navigate. The goal is to create a seamless flow that leads visitors naturally from product discovery to checkout without unnecessary interruptions.
Mobile users behave differently from desktop users, taps replace clicks, and screen space is limited. Mobile heatmaps reveal unique engagement patterns such as thumb-friendly areas and scroll depth. If users rarely reach the bottom of a product page on mobile, reposition critical information like pricing, shipping, and “Add to Cart” buttons higher up.
Also, check whether navigation menus or promotional banners take up too much space, pushing important content below the fold. Ensure buttons are large enough to tap comfortably and spaced properly to prevent misclicks. Regularly reviewing mobile heatmaps helps you maintain a responsive layout that feels intuitive on every device, improving user satisfaction and conversion rates.
If heatmaps show that users are consistently ignoring certain sections, such as promotional banners or testimonial carousels, it may be time to reorder your page hierarchy. Move high-performing sections (like featured products or reviews) higher up the page, where engagement is strongest.
Likewise, consider merging or removing underperforming elements to streamline the flow. The ultimate goal is to create a visual journey that matches how users naturally interact with your store, making each page both appealing and effective at driving action.
Rather than relying on a single heatmap type, combine click, scroll, and movement heatmaps to get a complete picture of visitor behavior. For instance, if a section shows high cursor movement but few clicks, it may attract attention without prompting action, indicating a need for clearer CTAs or interactive content.
By layering these insights together, you can redesign pages holistically, ensuring that content placement, visuals, and user paths all align with actual browsing habits. This data-driven approach reduces guesswork and helps you make design choices that directly support business goals.
By applying heatmap insights thoughtfully, you can continuously refine your store layout to match real user behavior. The result is a cleaner, more intuitive shopping experience that keeps visitors engaged longer, helps them find what they need faster, and ultimately drives more conversions.
Heatmaps are not a one-time tool but part of an ongoing optimization process. After implementing layout changes:
Some popular tools that integrate easily with eCommerce platforms include:
Heatmaps turn complex user behavior into clear visual insights that drive smarter layout decisions. By learning where visitors focus, click, and drop off, you can redesign your store to be more intuitive, engaging, and conversion-friendly.
For Shopify store owners, integrating a heatmap tool is one of the most effective ways to bridge the gap between design and performance, ensuring every element of your layout contributes to a seamless shopping experience and stronger sales.