Heatmaps and A/B Testing: Tools to Improve Conversion Rates
Technology
Sep 30, 2025
10M
Alice Pham
Getting visitors to your website is one milestone, but turning them into customers, subscribers, or leads is where real success lies. Conversion optimization is not about guesswork, but it requires a scientific approach backed by data. Businesses often face the same problem: plenty of visitors come to their site, but too few take the desired action. The question is: why?
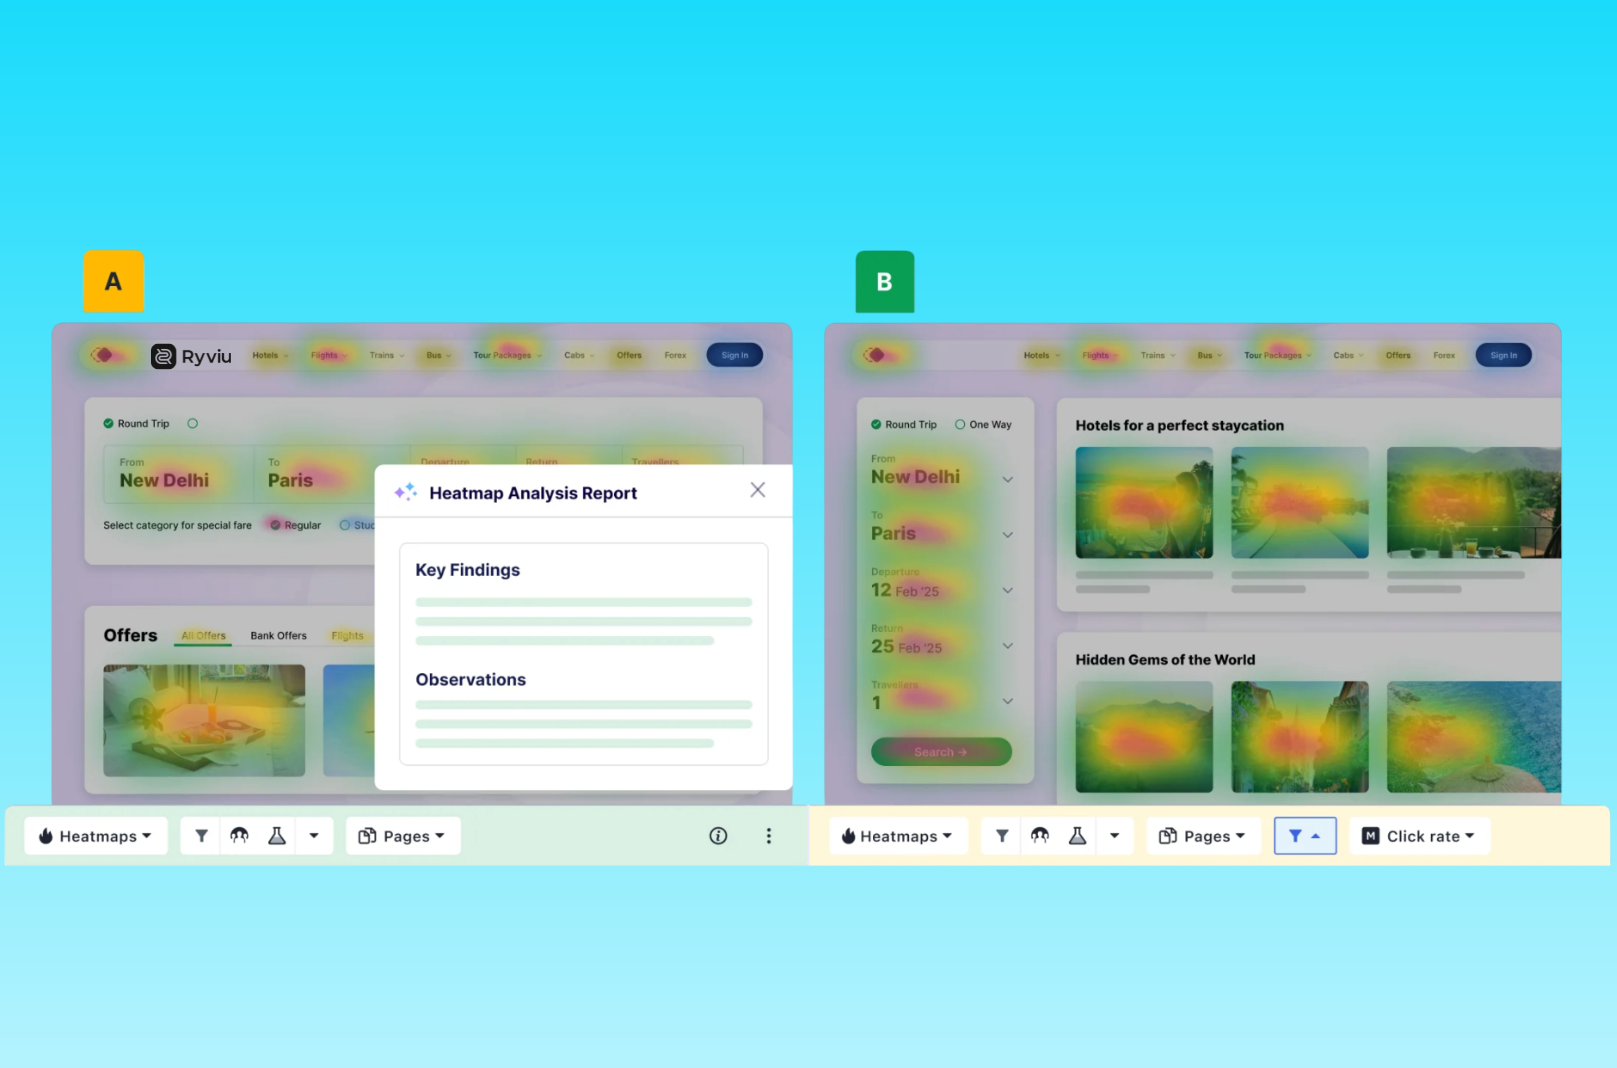
This is where heatmaps and A/B testing come into play. Both are tools designed to improve conversion rates, but they work in different, complementary ways. Heatmaps provide a visual representation of user behavior, showing you what people do on a page where they click, scroll, or lose interest. A/B testing, on the other hand, goes one step further by experimenting with different versions of a page or element to determine which performs better.
Comparing these two tools helps marketers, designers, and business owners decide when to use one, when to use the other, and most importantly, how to combine them for maximum impact. In this article, we’ll dive deep into their differences, strengths, weaknesses, and use cases, and explore how together they create a powerful cycle of continuous optimization.
Heatmaps: Observing What Users Do
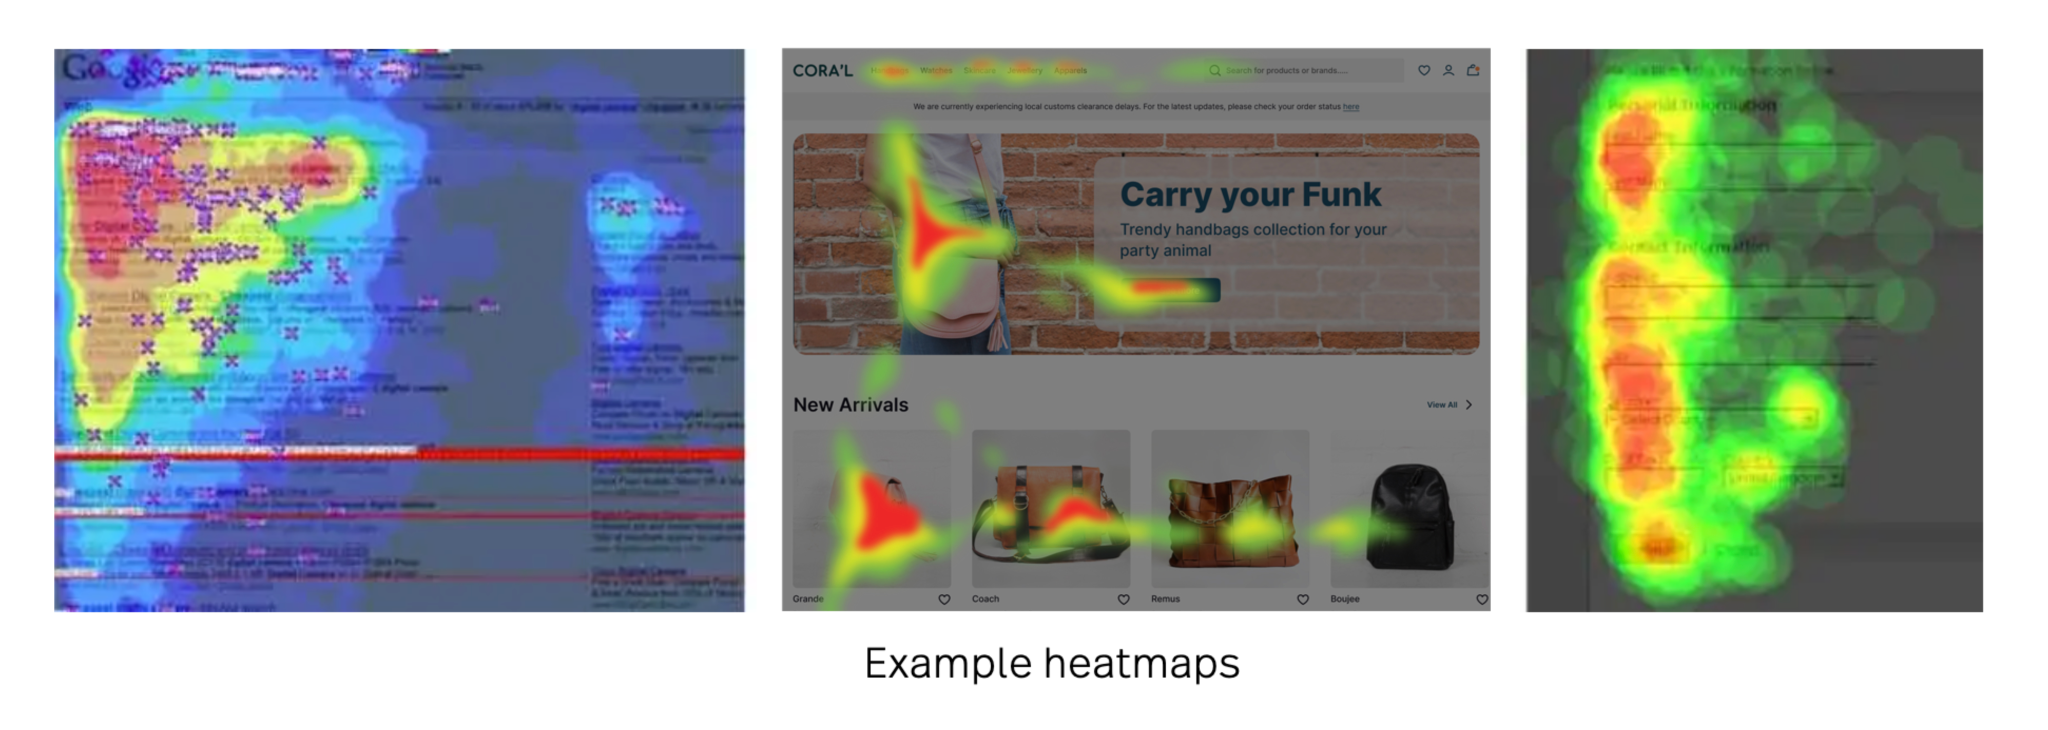
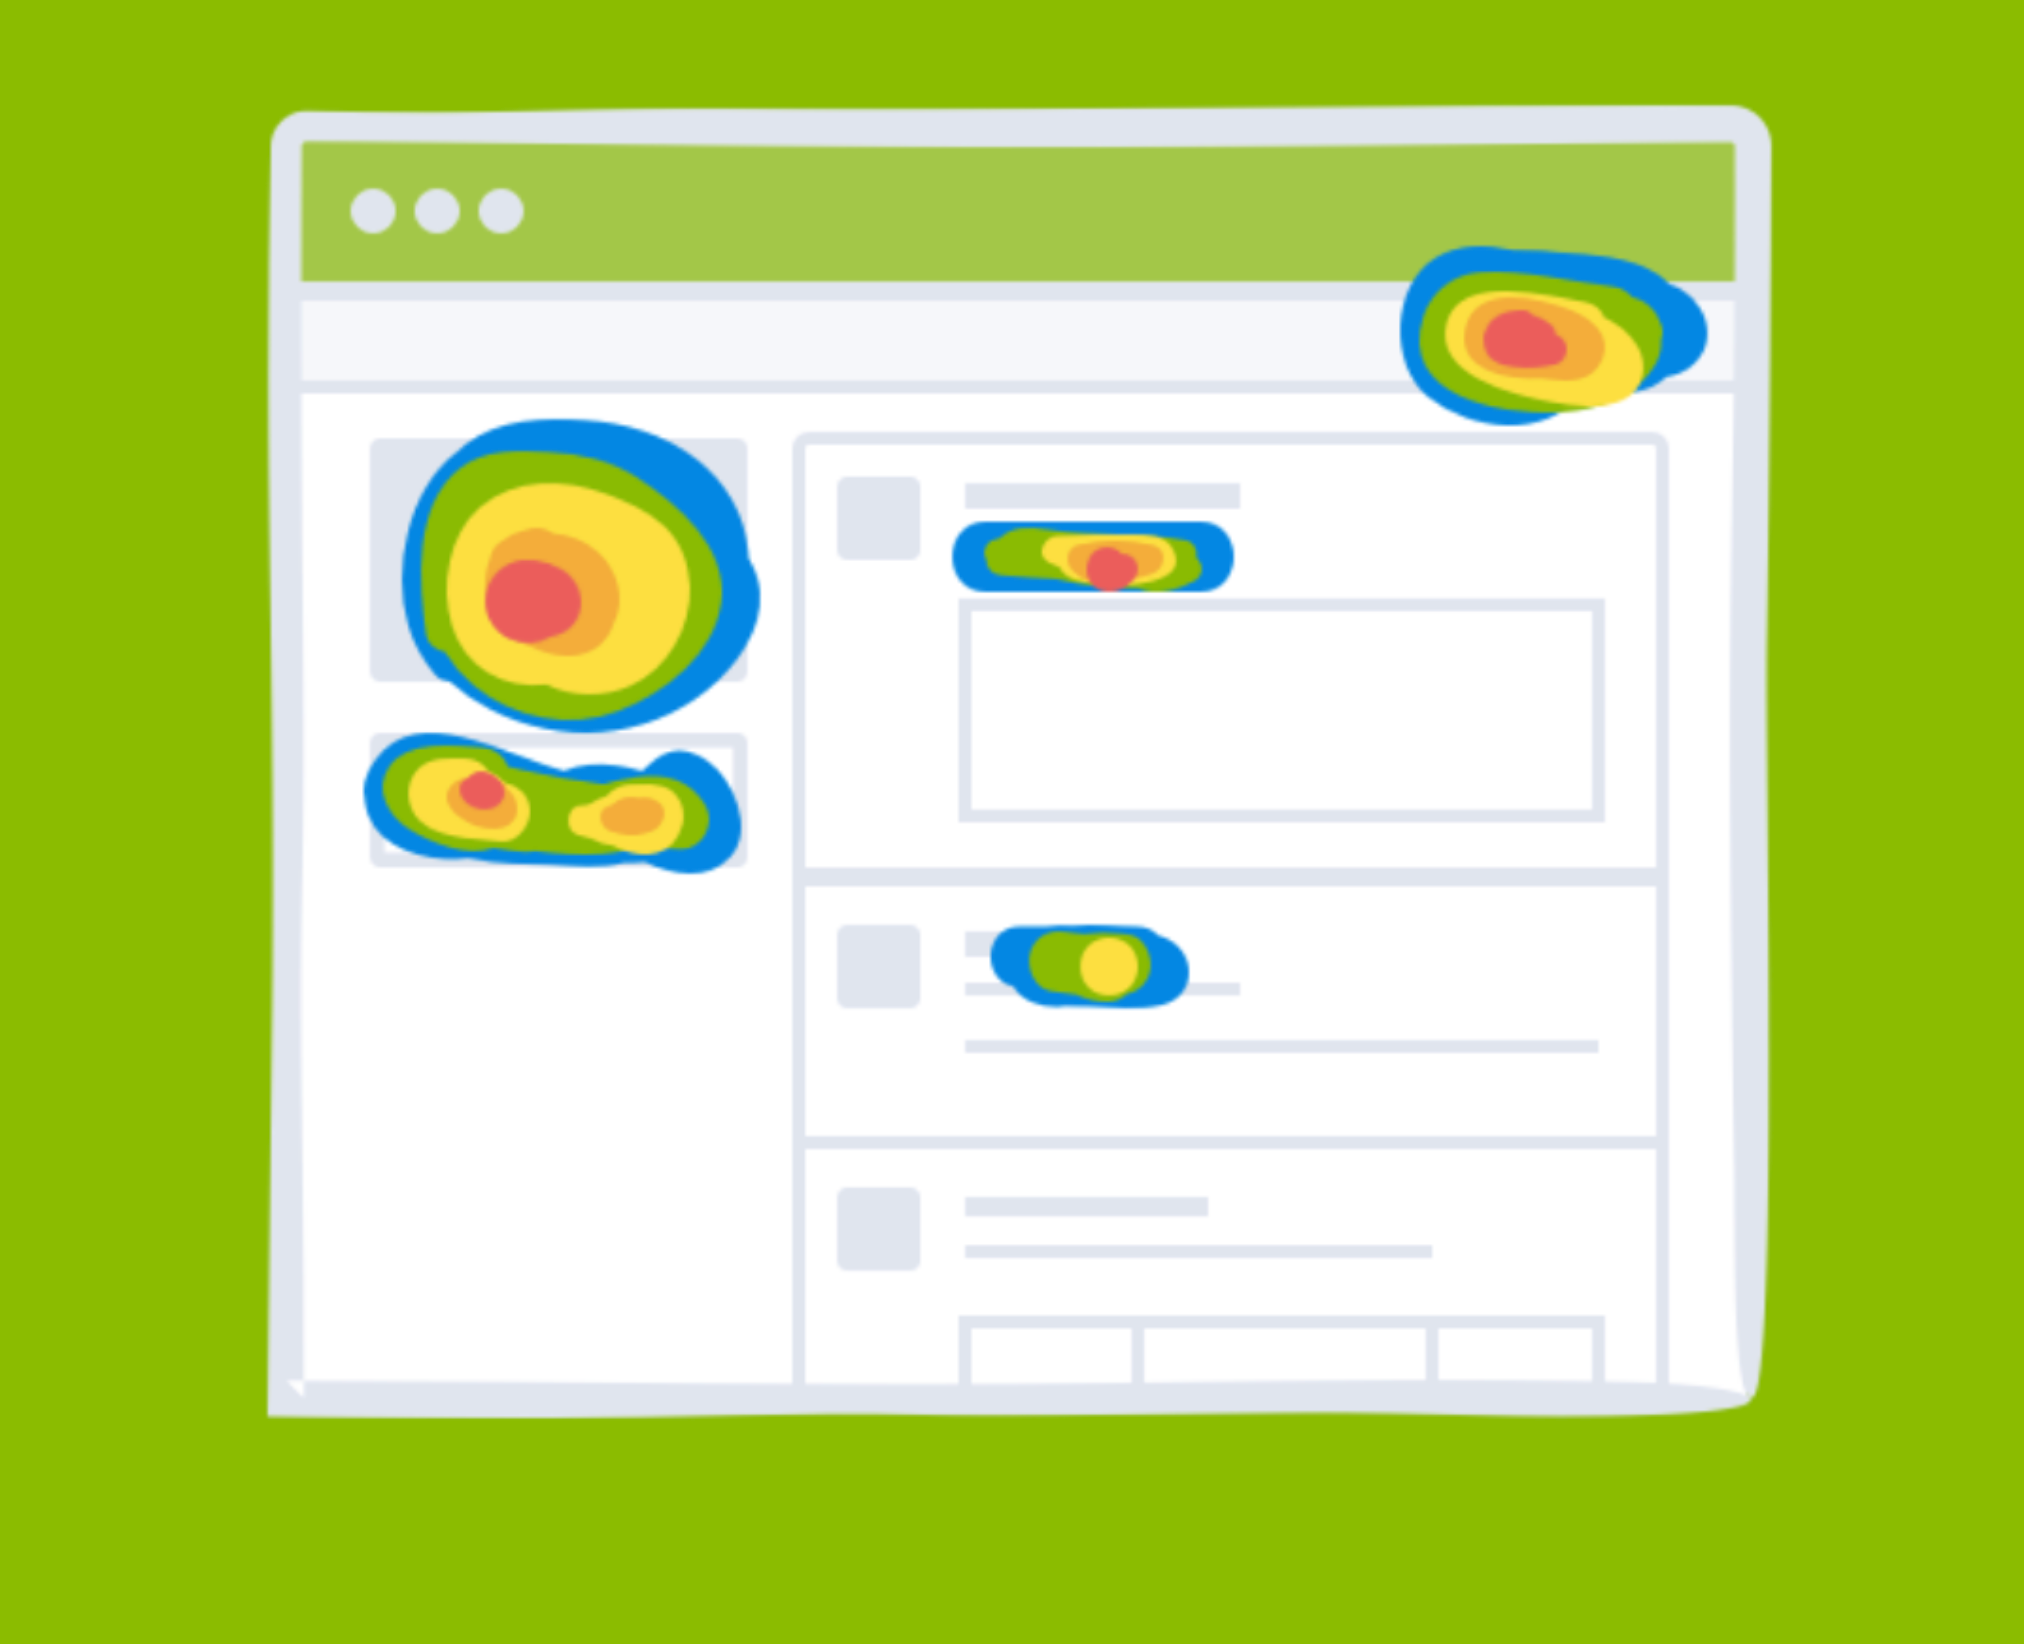
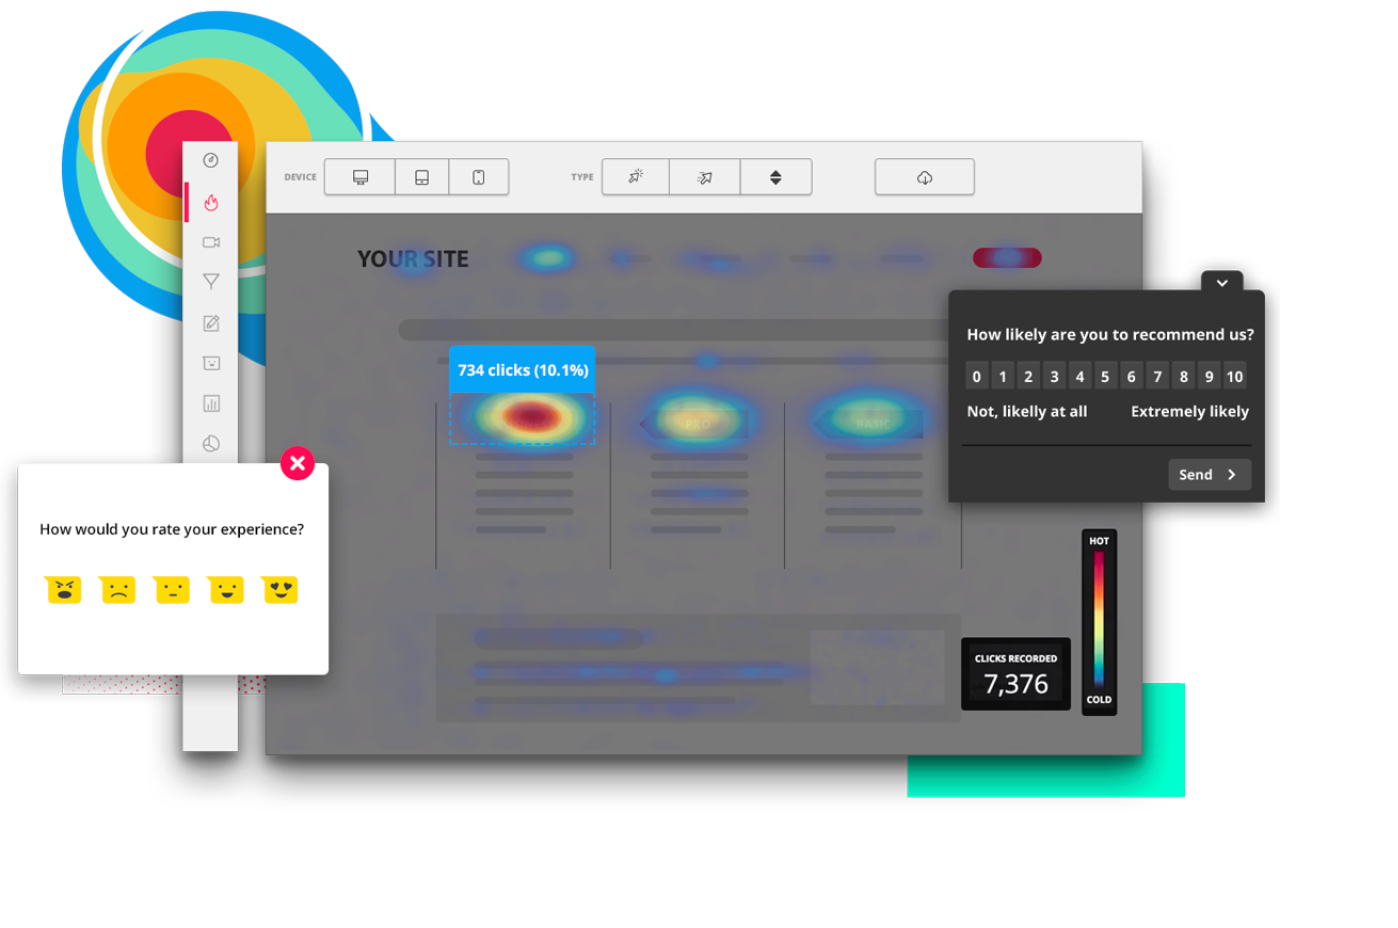
A heatmap is essentially a diagnostic tool. It doesn’t change anything on your website but instead collects data about how visitors interact with your pages. The output is a color-coded visual that highlights activity, with “hot” areas (red, orange, yellow) showing the most engagement and “cold” areas (blue, green) showing the least.
Why Heatmaps Matter?
Heatmaps provide quick, visual insights that even non-technical team members can understand. Instead of looking at numbers in a spreadsheet, you can literally “see” where users are focusing their attention. For instance, if a key button is cold blue, that’s an immediate signal that it isn’t attracting clicks.
They are especially useful when:
You suspect that important elements are being overlooked.
You want to know how far visitors scroll before abandoning a page.
You’re trying to identify distracting or confusing page elements.
Strengths of Heatmaps
Visual Evidence: Easy-to-understand representations help bridge communication gaps between marketers, designers, and stakeholders.
Identify UX Issues: Spot patterns like ignored CTAs or users clicking on non-clickable elements (e.g., images).
Content Placement Optimization: Understand whether users actually see your most valuable content.
Speed: Patterns can emerge quickly, sometimes within a few days if traffic is high.
Limitations of Heatmaps
Despite their usefulness, heatmaps have boundaries:
They show what people do, but not why. For example, users might click on an image thinking it’s a button, but the heatmap alone won’t explain their intent.
Heatmaps require enough traffic to produce meaningful results. A few dozen visits won’t tell the full story.
They are snapshots, not solutions. While they can identify problems, they cannot test whether proposed fixes will work.
A/B Testing: Validating What Works
Where heatmaps stop, A/B testing begins. A/B testing is all about experimentation. Instead of observing current behavior, it actively changes a variable and measures whether the new version performs better.
Why A/B Testing Matters?
A/B testing allows businesses to make evidence-based decisions instead of relying on intuition or design trends. For example, while a designer may prefer a minimalist button, the test might show that a bold, contrasting button color drives significantly more conversions.
How It Works
Form a Hypothesis: Based on observations (often from heatmaps), you guess what change could improve performance.
Create Variants: Build two versions of a page, Version A (the control) and Version B (the variation).
Split Traffic: Divide visitors randomly between the two versions to avoid bias.
Measure Results: Track conversions, clicks, or other KPIs to see which version performs better.
Draw Conclusions: Once statistical significance is reached, declare a winner.
Strengths of A/B Testing
Proves Causality: Unlike heatmaps, it doesn’t just show behavior but confirms whether a specific change is responsible for improvements.
Quantitative and Reliable: Results are backed by numbers, making them persuasive for stakeholders.
Versatile: Can test anything, such as headlines, CTAs, layouts, pricing, images, or even checkout flows.
Limitations of A/B Testing
Resource-Heavy: Designing, running, and analyzing tests requires time and traffic.
Only as Good as the Hypothesis: Poorly chosen tests may waste time without yielding useful insights.
Incremental: A/B testing is excellent for refining, but it rarely uncovers completely new problems (that’s where heatmaps shine).
Heatmaps vs. A/B Testing: A Comparative Breakdown
Although both tools share the same goal, improving conversions, they differ in approach, output, and purpose.
Put simply: heatmaps are the detective; A/B testing is the courtroom trial. One gathers clues, the other proves the case.
Comparative Applications
Call-to-Action (CTA) Buttons
Heatmaps: Show whether users even notice your CTA. If clicks are low, it may be too small or misplaced.
A/B Testing: Confirms whether changing color, text, or position boosts conversion rates.
Landing Page Layouts
Heatmaps: Reveal if visitors scroll past key content or abandon halfway down the page.
A/B Testing: Tests whether a shorter, more concise layout outperforms the longer version.
Navigation Menus
Heatmaps: Identify which links are popular and which are ignored.
A/B Testing: Validates whether reorganizing or simplifying menus improves engagement.
Checkout Forms
Heatmaps: Highlight where users hesitate or abandon the form (e.g., a field that takes too long to fill).
A/B Testing: Tests shorter vs. longer forms or rearranged field order to improve completion rates.
E-commerce Product Pages
Heatmaps: Show which images or product details capture attention.
A/B Testing: Confirms whether alternate image layouts, pricing displays, or copywriting drive more sales.
When to Use Heatmaps vs. A/B Testing?
Start with Heatmaps: If you don’t know what’s wrong, heatmaps are faster and cheaper for diagnosing user behavior issues. They give you a quick snapshot of how people are interacting with your website without requiring technical setup or long waiting times. For small teams or businesses just beginning their optimization journey, heatmaps provide an accessible entry point to understanding user behavior.
Move to A/B Testing: Once you have a hypothesis, use A/B testing to confirm whether your proposed fix works. This step is essential because what looks like a problem in a heatmap might not actually affect conversions until tested. A/B testing allows you to separate assumptions from reality by showing statistically significant results before making big changes.
Think of it this way: If you’re a doctor, heatmaps are the X-ray showing where the problem lies, and A/B testing is the treatment plan tested on patients. The two methods are complementary: diagnosis without treatment leaves the issue unresolved, while treatment without diagnosis risks targeting the wrong problem. By combining both, you ensure accuracy in identifying issues and confidence in applying the right fixes.
How Do They Complement Each Other?
Instead of treating heatmaps and A/B testing as competing tools, smart businesses use them together. Both tools cover gaps left by the other, heatmaps identify what’s going wrong, and A/B testing confirms the right solution. This creates a closed loop of continuous improvement rather than relying on guesswork or incomplete data.
Observation Stage (Heatmaps): Example: A scroll heatmap reveals that users don’t reach the CTA button at the bottom of the page. This insight tells you that visibility is an issue, but it doesn’t tell you whether moving the button will solve it. At this stage, the goal is to collect evidence that directs you toward a potential solution.
Hypothesis Stage: You hypothesize that moving the CTA higher up will increase clicks. A clear hypothesis is crucial because it provides a focused question to test, rather than randomly changing design elements. This step bridges the gap between raw data and actionable improvement.
Experimentation Stage (A/B Testing): You create two versions: one with the button at the bottom, one with it mid-page. Dividing traffic between the two ensures a fair test and prevents outside influences from skewing the results. This stage is where theory meets reality, and your ideas are put to the test.
Validation Stage: After testing, the mid-page button increases conversions by 25%. This result gives you statistical proof that the change works, justifying the decision to implement it across your site. Without validation, you risk making changes that feel right but don’t actually improve performance.
This cycle ensures that optimizations aren’t based on guesswork but on observed behavior followed by proven results. It encourages an ongoing culture of testing and learning, where each insight builds on the previous one to drive long-term growth. Over time, this systematic approach can transform small tweaks into significant, compounded gains.
Tools That Combine Both Heatmaps and A/B Testing
Instead of juggling multiple tools, some platforms offer both heatmaps and testing:
Crazy Egg: Offers click heatmaps and simple A/B tests.
Using integrated tools streamlines workflows and ensures insights turn into action faster.
Common Pitfalls in Comparing Both
Using Only One Tool: Heatmaps without A/B testing stop short of proving solutions, while A/B testing without heatmaps risks testing random guesses.
Overgeneralizing Results: What works for one audience segment (desktop users) may fail for another (mobile users). Always segment your data.
Stopping Tests Too Early: A/B tests need sufficient time to reach statistical significance; rushing can lead to false conclusions.
Misinterpreting Heatmaps: Hot zones don’t always mean engagement, but they can also indicate confusion. For example, users clicking an image expecting it to be clickable.
Conclusion
Heatmaps and A/B testing are two sides of the same conversion optimization coin. Heatmaps are powerful for diagnosing problems, while A/B testing validates which changes deliver measurable results.
Heatmaps = fast, visual, diagnostic
A/B Testing = slower, statistical, confirmatory
When compared, it’s clear each has strengths and weaknesses. But when combined, they create a continuous loop of improvement: observe → hypothesize → test → refine.
In a competitive digital landscape, relying on guesswork is no longer enough. Businesses that use both heatmaps and A/B testing systematically can uncover hidden obstacles, validate their solutions, and steadily increase conversions over time. The smartest approach is to integrate both into your optimization toolkit.