Please select the platform to login


Understanding your customers’ behavior is the foundation of successful eCommerce growth. On Shopify, user behavior analytics tools help you see how shoppers browse, where they drop off, and what drives them to purchase. These insights go far beyond simple traffic numbers, they reveal the motivations, frustrations, and habits that shape every sale. By combining behavioral data with heatmaps, session replays, and advanced funnels, you can make smarter decisions that increase conversions, reduce cart abandonment, and enhance the shopping experience. Let's explore top 10 best tools for analyzing user behavior on your Shopify store.
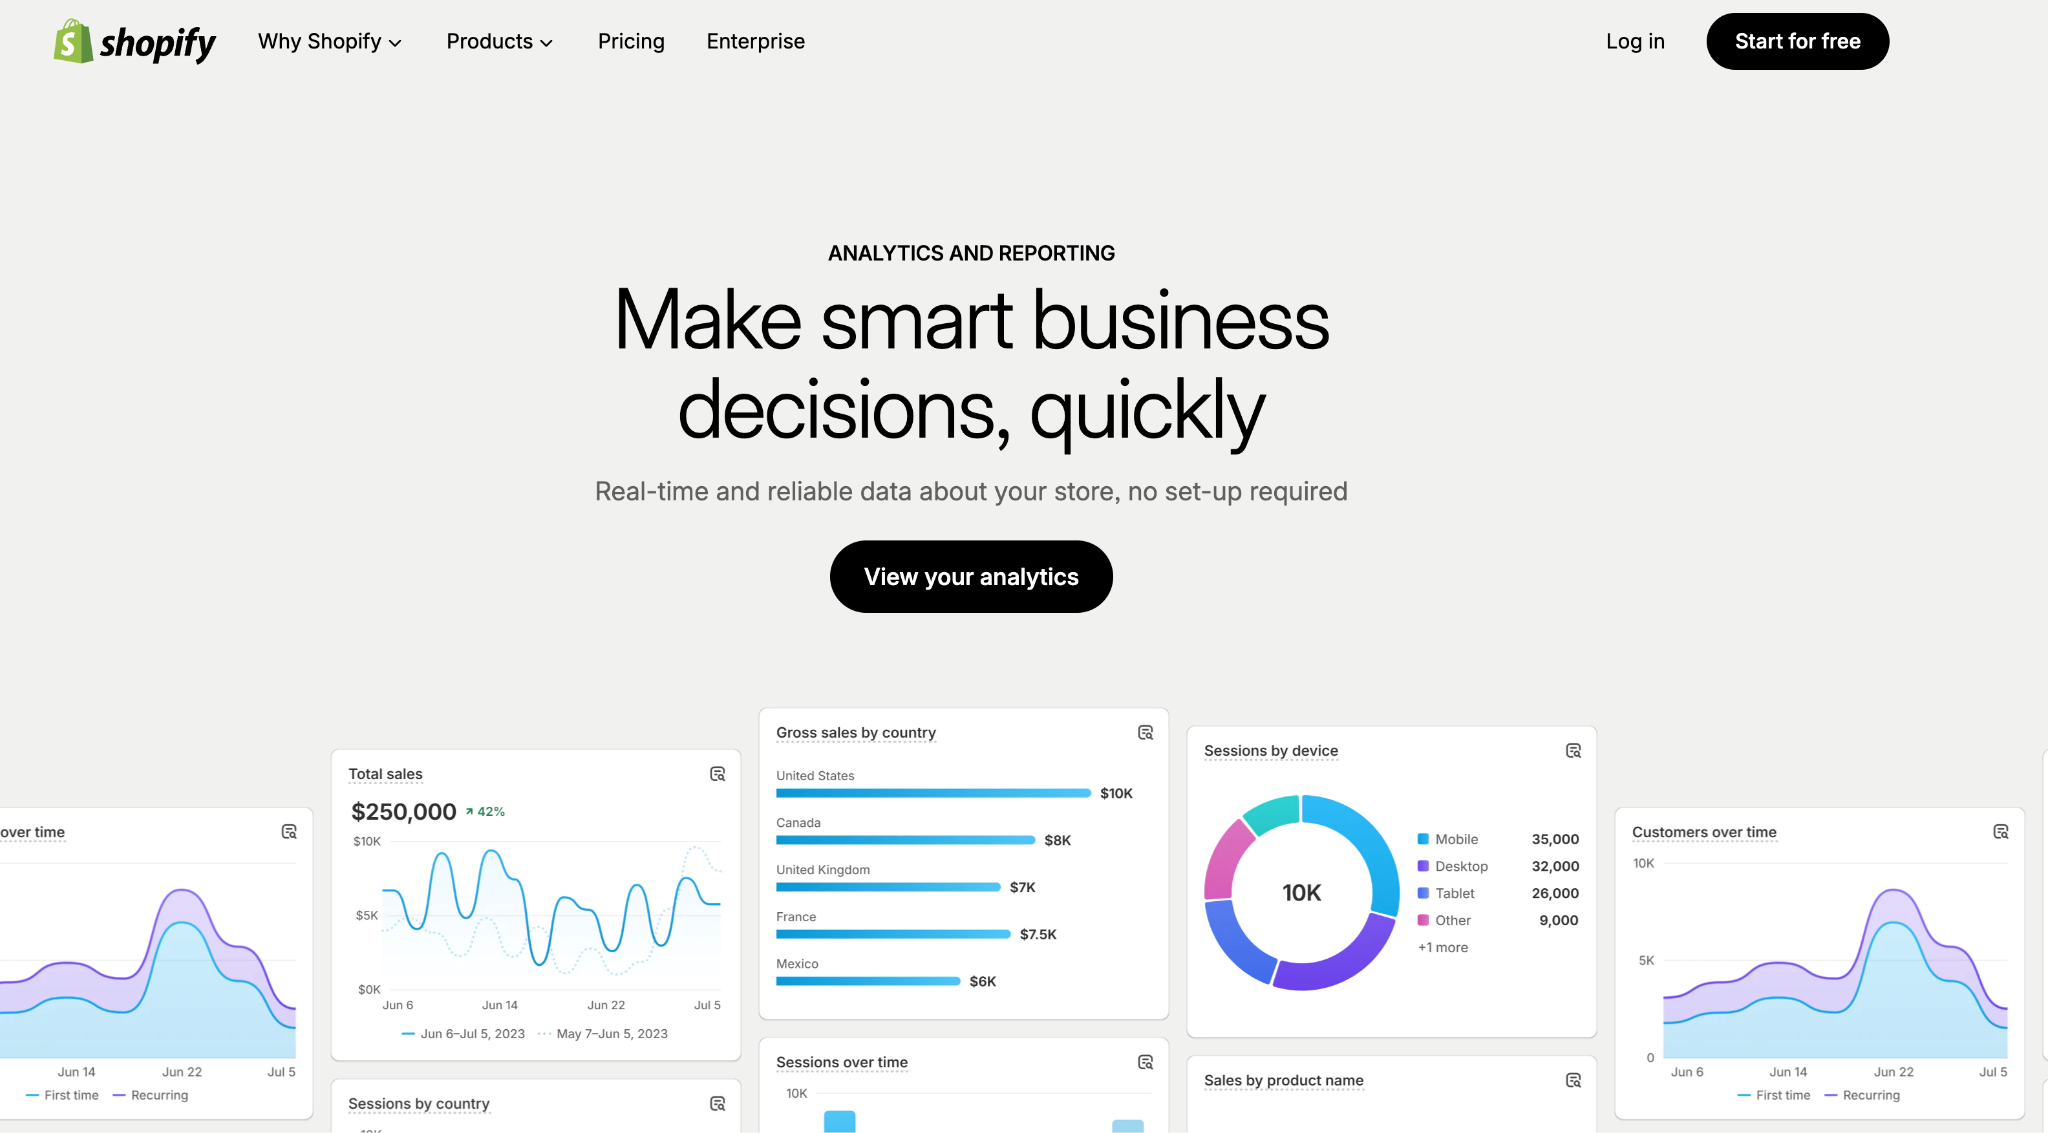
Shopify’s built-in analytics and reports give a first-line view of store performance: traffic, sales, conversion rates, product performance, and basic customer behavior. It’s tightly integrated with your store (no extra coding) and useful to quickly see which pages and products drive revenue. The depth of reporting depends on your Shopify plan, higher tiers unlock richer, customizable reports and longer data retention. For many stores Shopify Analytics is enough for everyday decisions; pair it with a session-replay or heatmap tool when you need qualitative insights.
Key features
Pricing
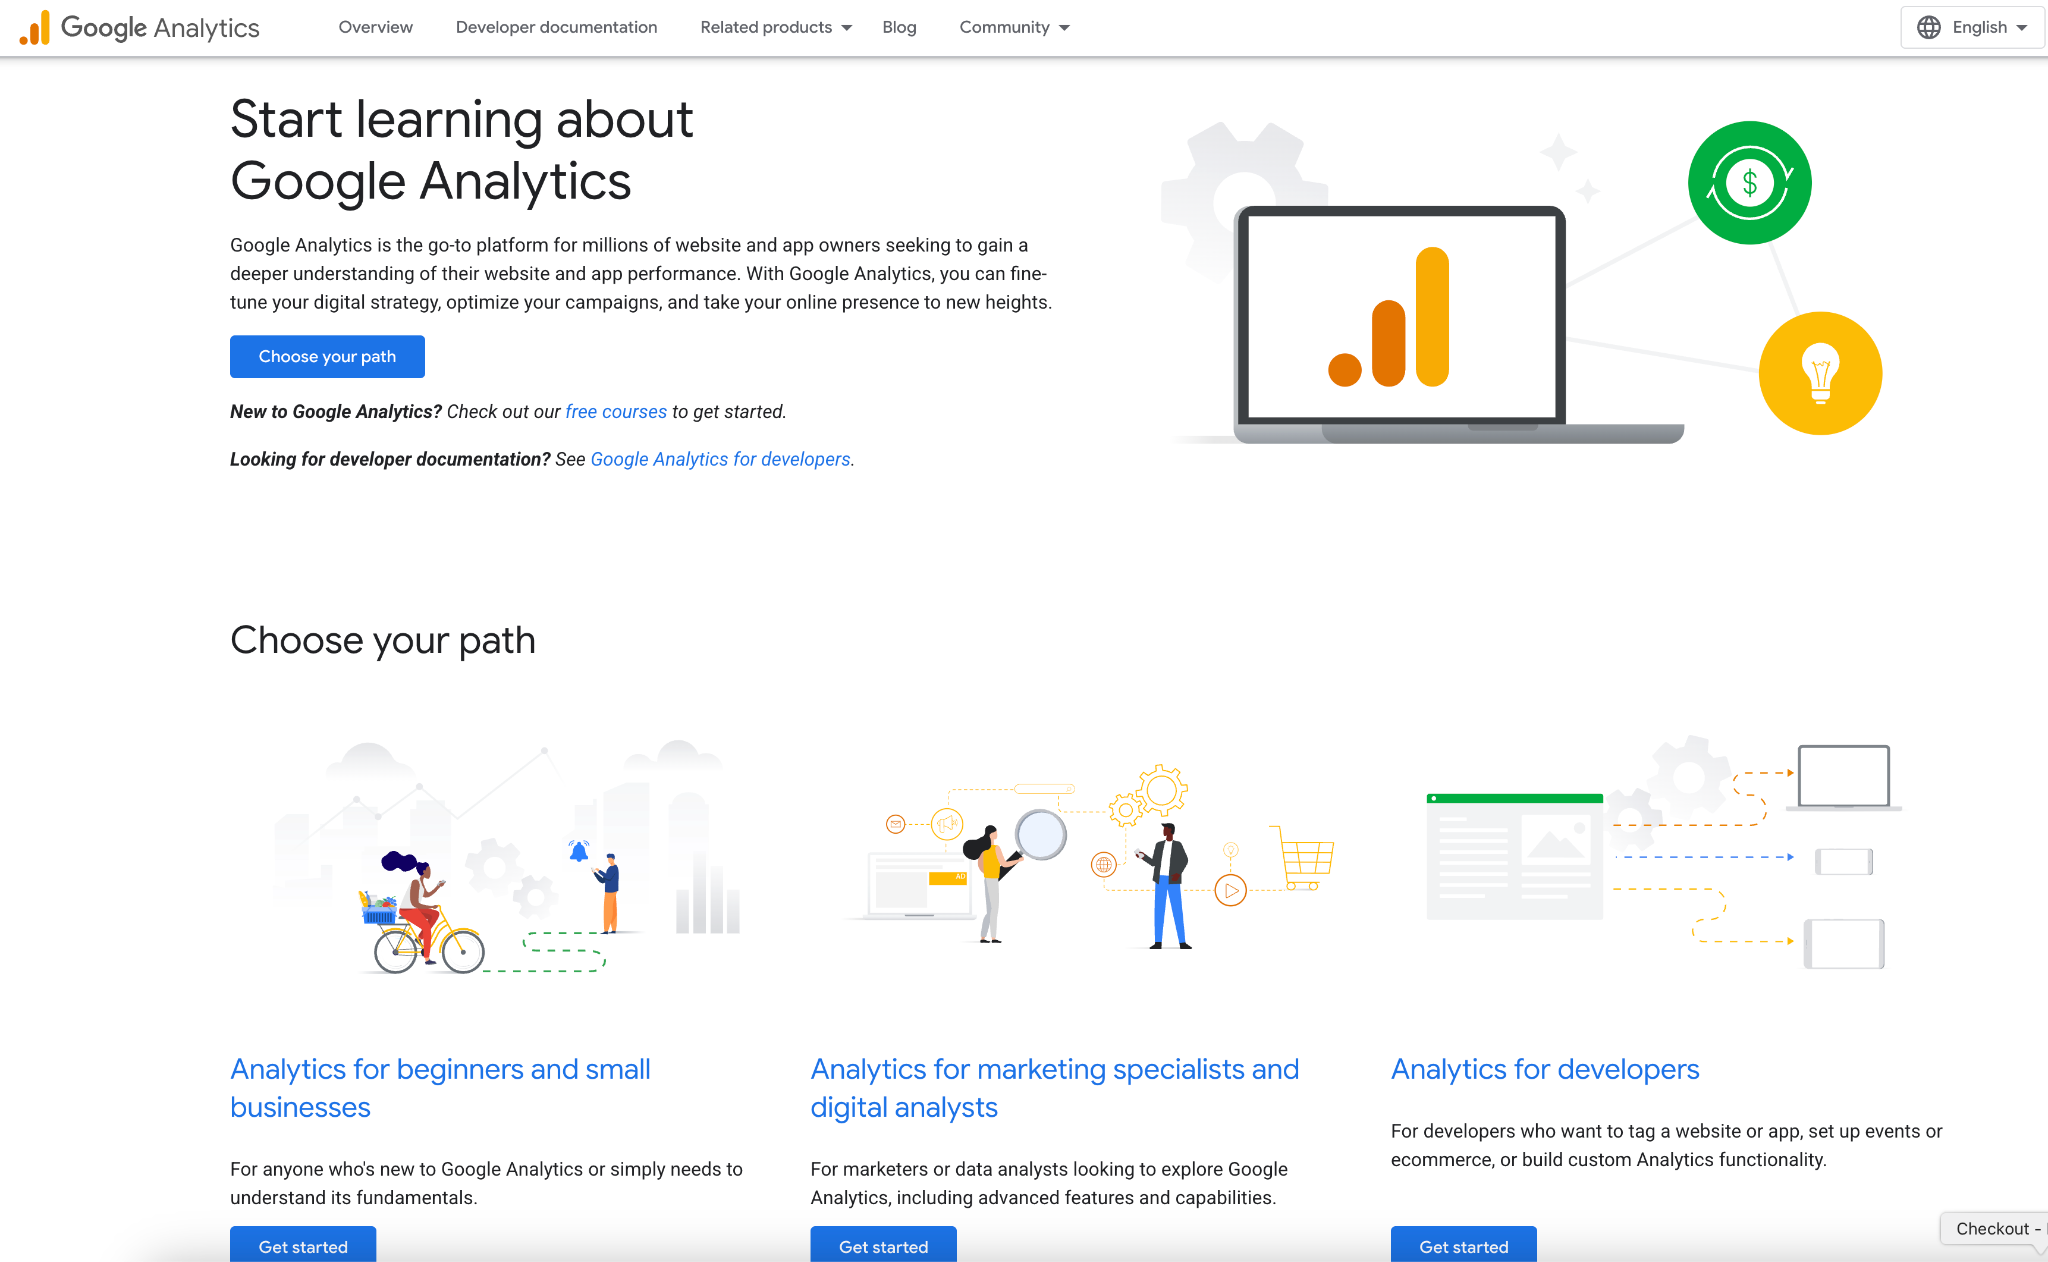
GA4 provides robust, event-driven analytics that complements Shopify’s native reports, excellent for tracking detailed funnels, multi-channel attribution, and custom events (like add-to-cart, checkout steps, promotions). It’s free for most merchants and integrates with Google Ads and Looker Studio for reporting. GA4 excels at cross-device user journeys and long-term cohort analysis, although it requires setup (events + ecommerce tagging) to get the best ecommerce insights. If your store grows, Google also offers a paid enterprise option (GA4 360) for very high volumes.
Key features
Pricing snapshot
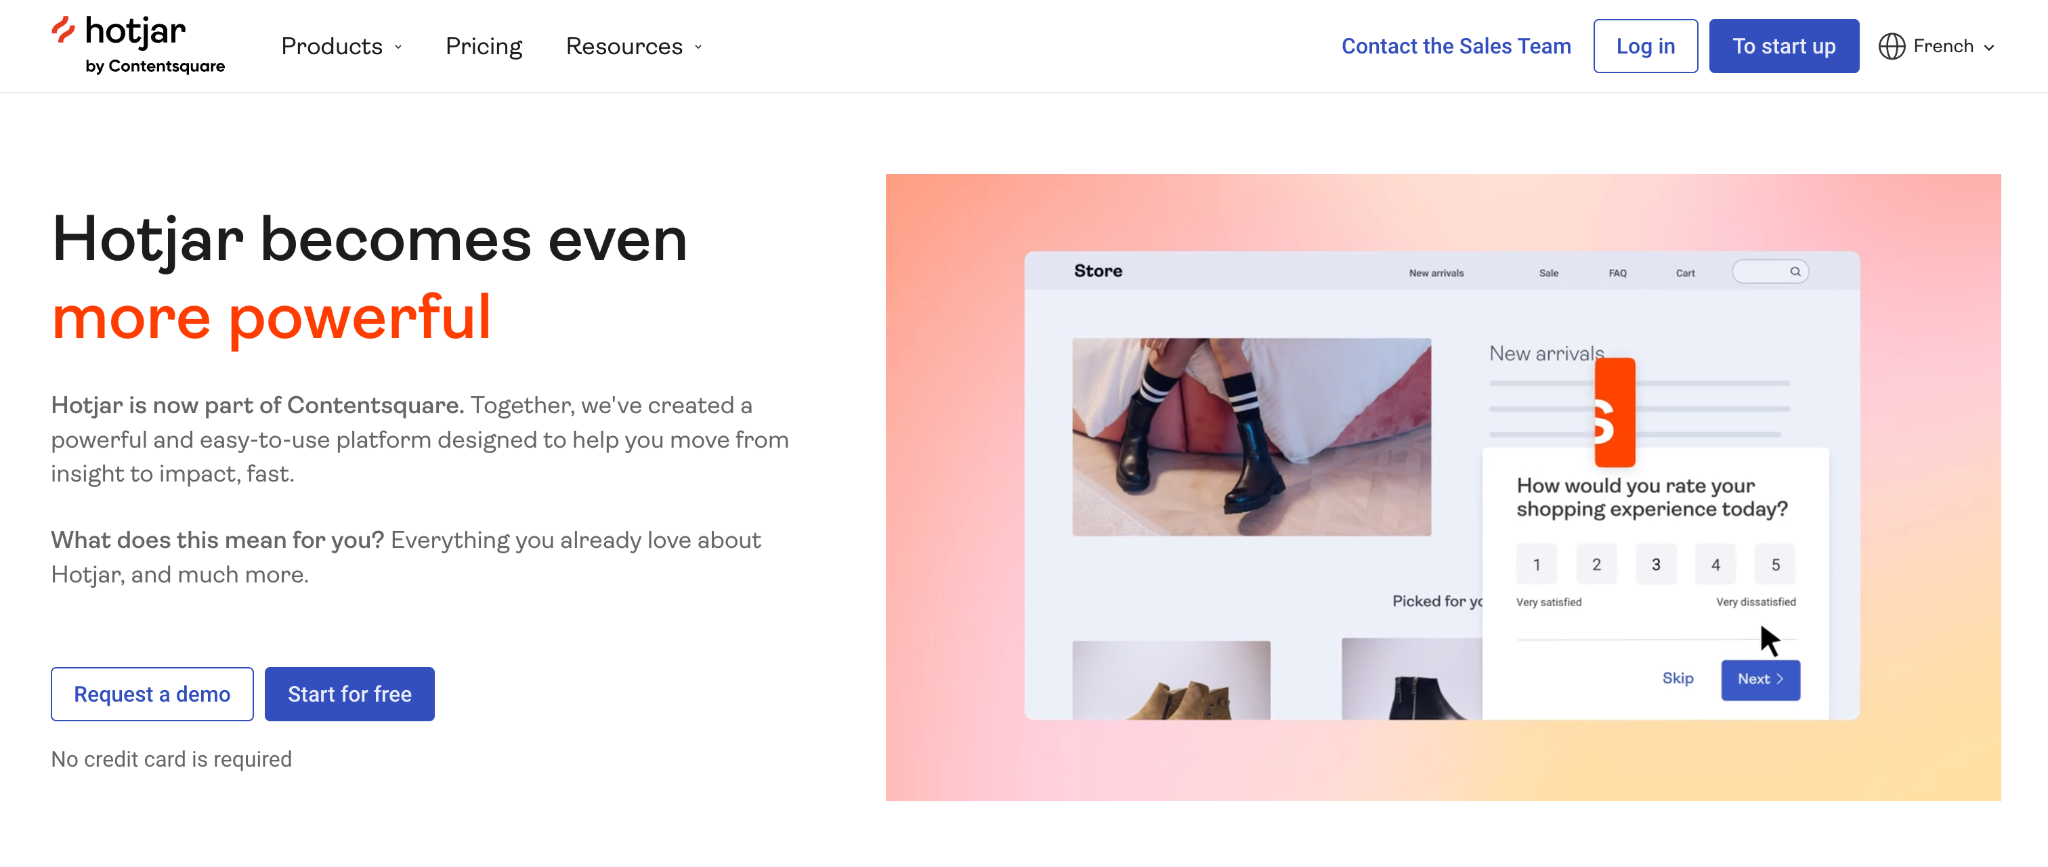
Hotjar provides heatmaps, session recordings, and conversion funnels that turn quantitative signals into qualitative understanding, where users click, how they scroll, and where they get stuck. In 2024–25 Hotjar became part of Contentsquare, which extended its analytics and AI features; it remains easy to install on Shopify stores via the theme or tag manager. Hotjar is ideal for spotting UX friction quickly (e.g., confusing CTAs or broken forms) and for running on-site surveys to capture user intent. Use Hotjar for fast qualitative insights alongside GA4 or Shopify Analytics for quantitative context.
Key features
Pricing:
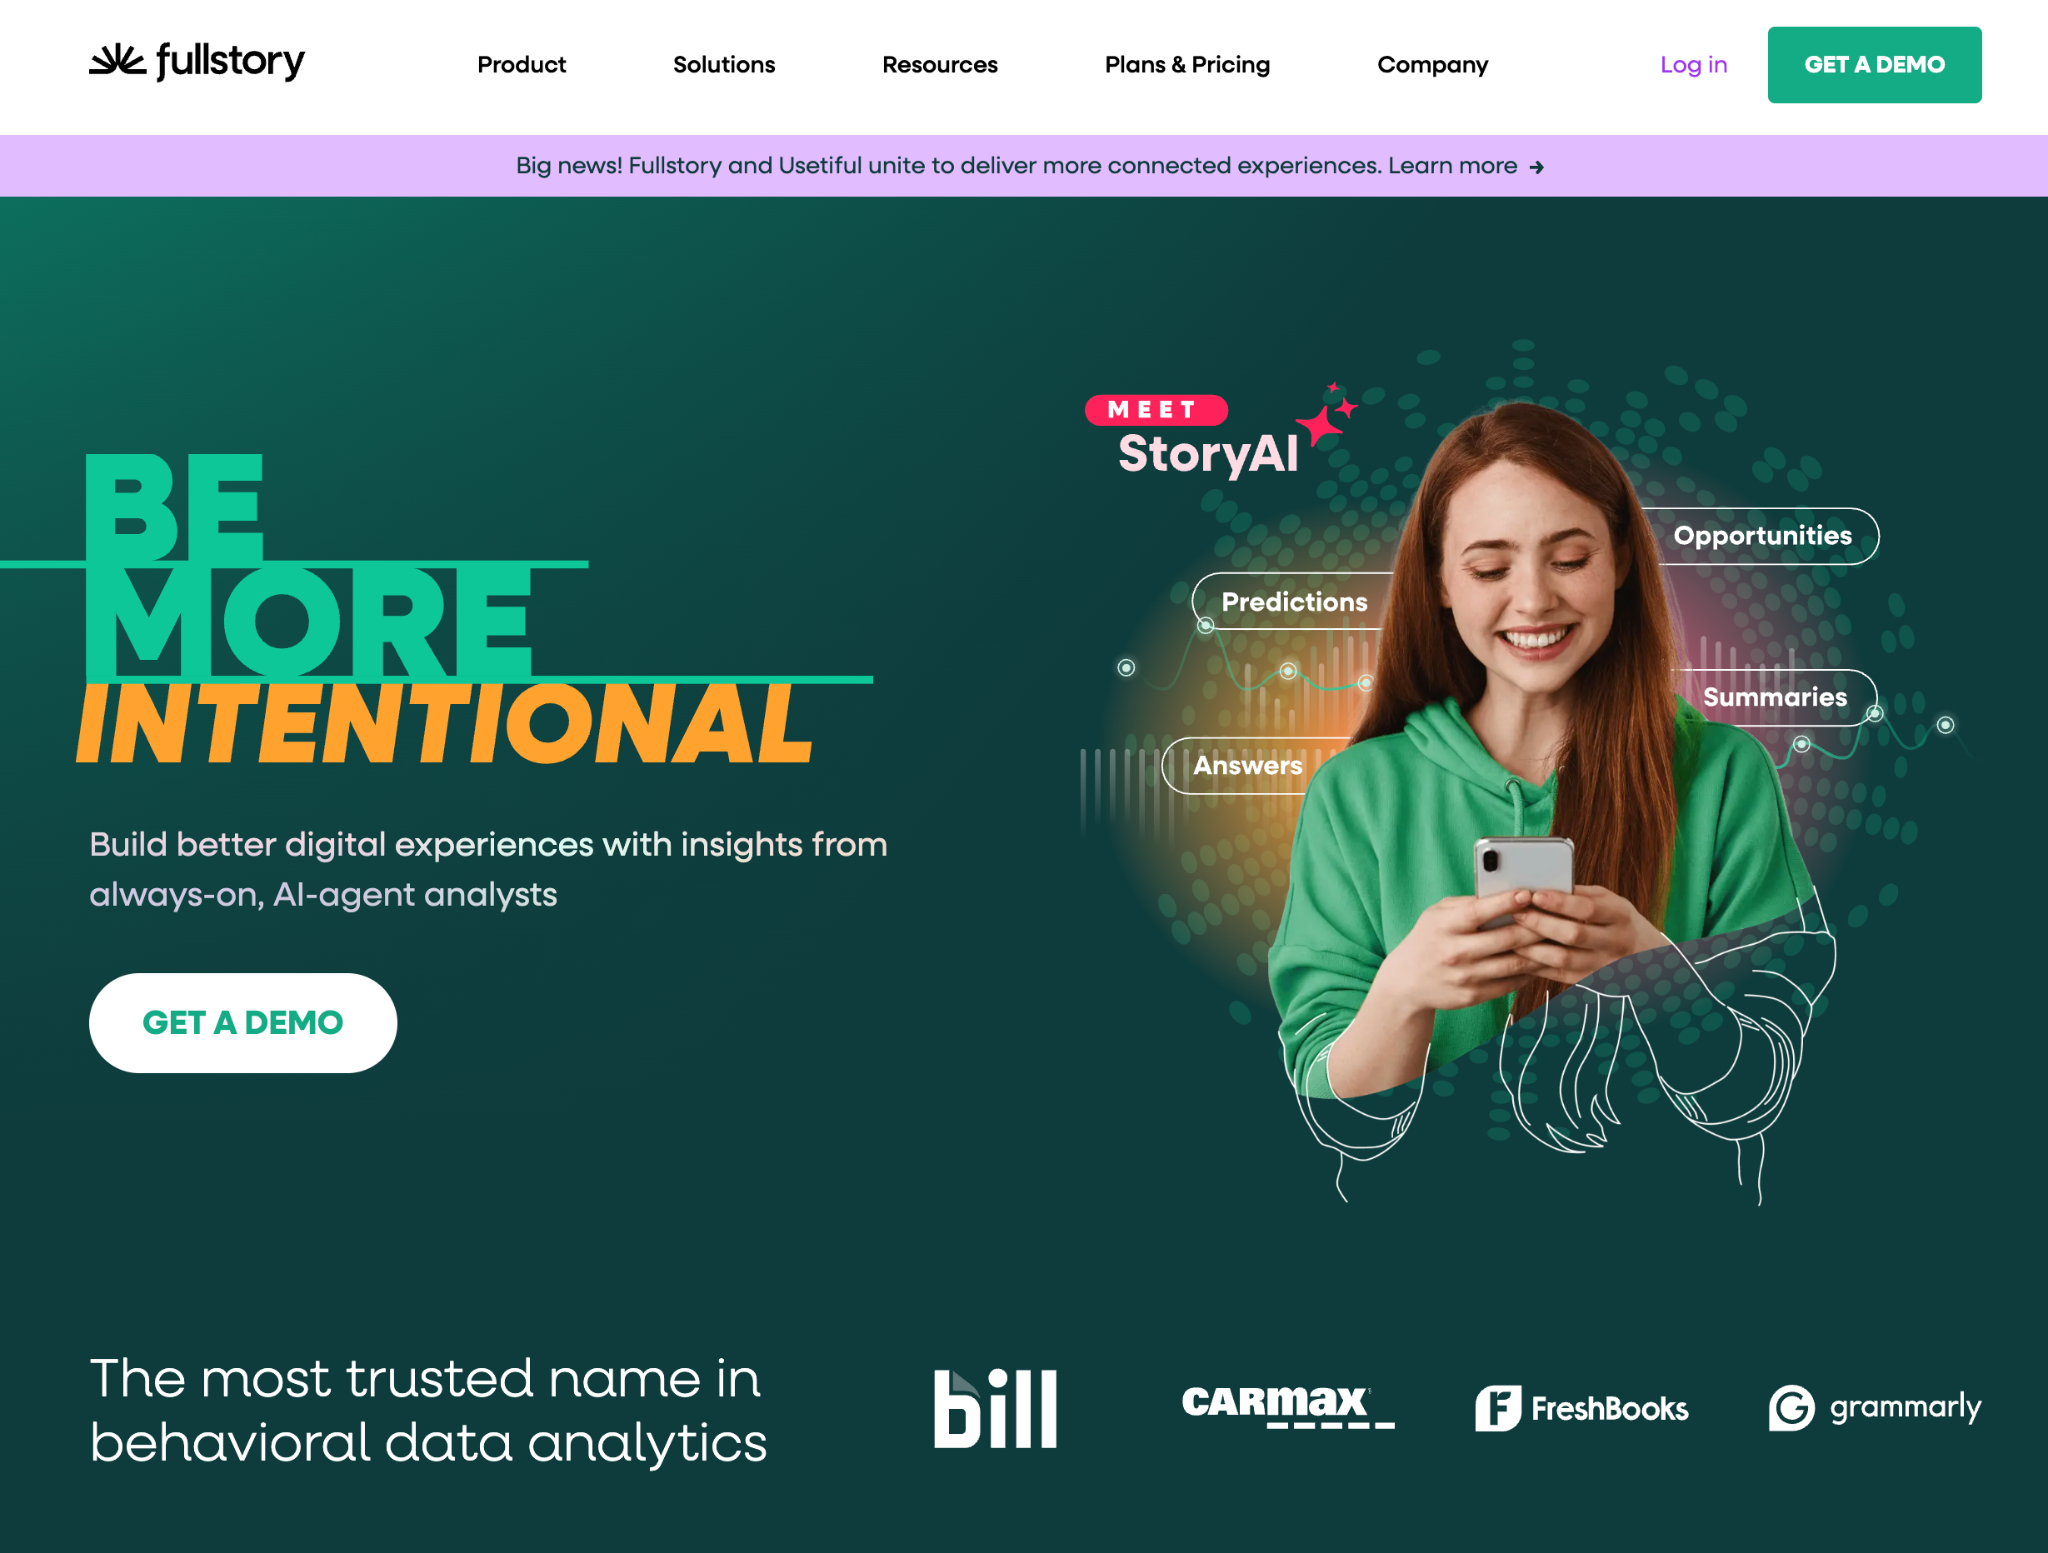
FullStory offers high-fidelity session replay, powerful search/filtering of user sessions, and advanced behavioral analytics driven by “frustration” signals (rage clicks, dead clicks). It’s designed for product teams that want to investigate issues quickly and quantify the impact of UX problems on conversions. FullStory’s plans range from a free trial/limited tier up to enterprise packages with broader data access and integrations, pricing for business/enterprise plans is typically custom. If you need rich session context plus structured analytics (not just replays), FullStory is a strong choice.
Key features
Pricing
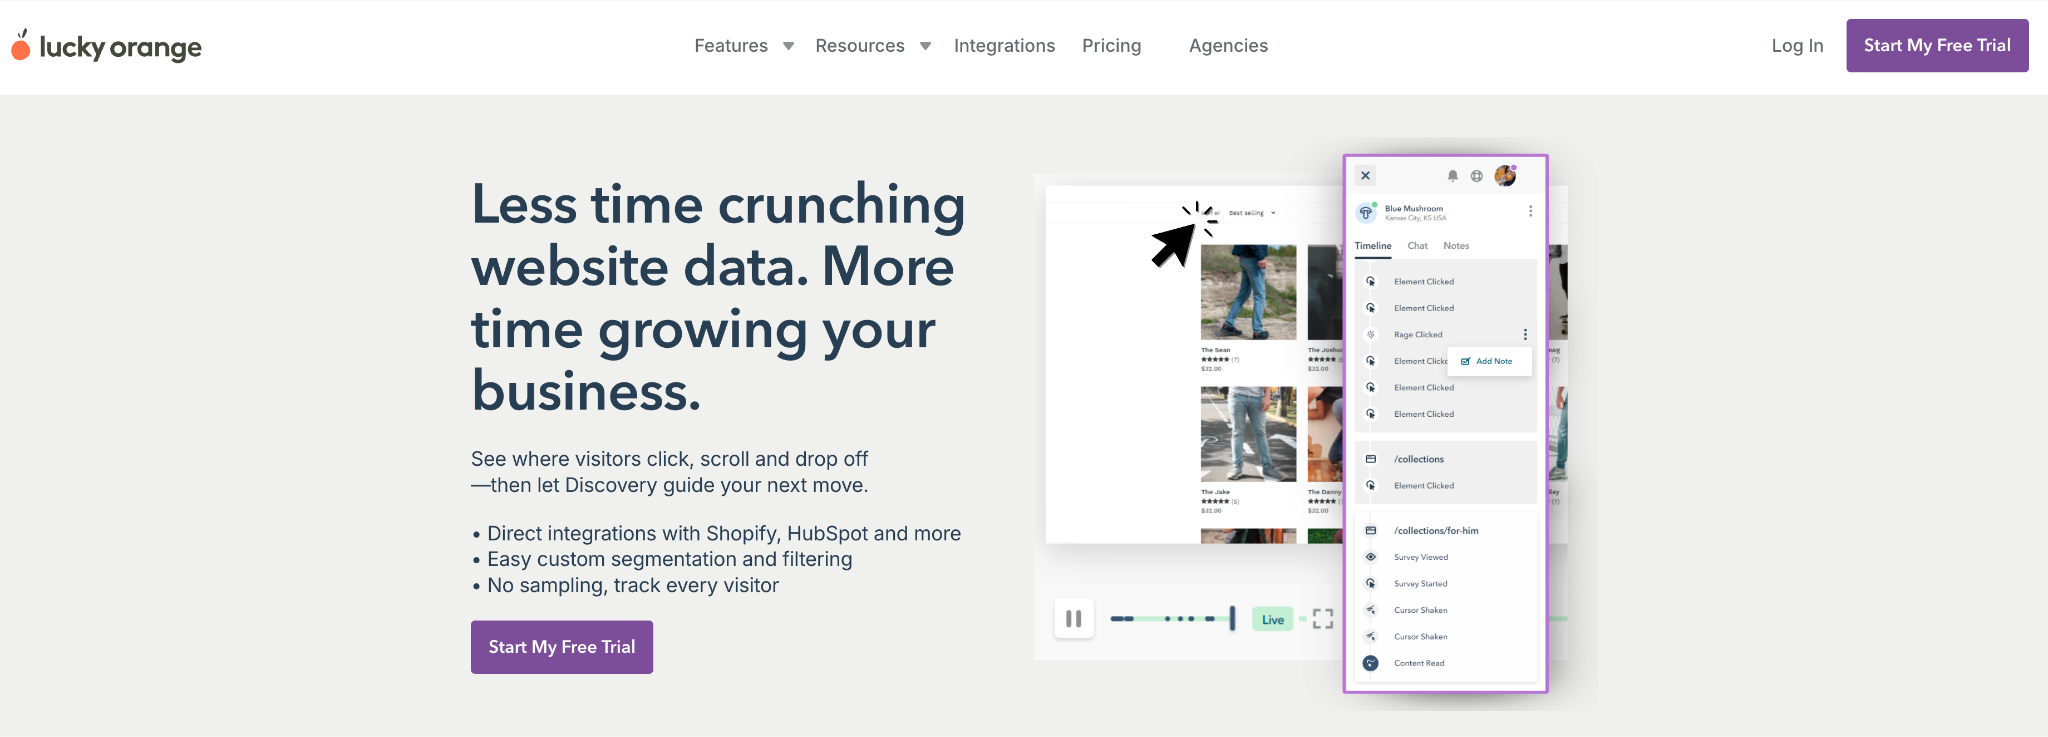
Lucky Orange bundles heatmaps, session recordings, conversion funnels, form analytics, and live chat into an affordable, Shopify-friendly package. It’s an approachable tool for small and mid-sized merchants who want qualitative replay and real-time visitor monitoring without a big budget. You can watch visitors live, see their clicking/scrolling behavior, and use surveys or chat to recover abandoning shoppers. Lucky Orange’s Shopify App listing shows straightforward pricing tiers that scale with session volumes, making it easy to start small and grow.
Key features
Pricing:
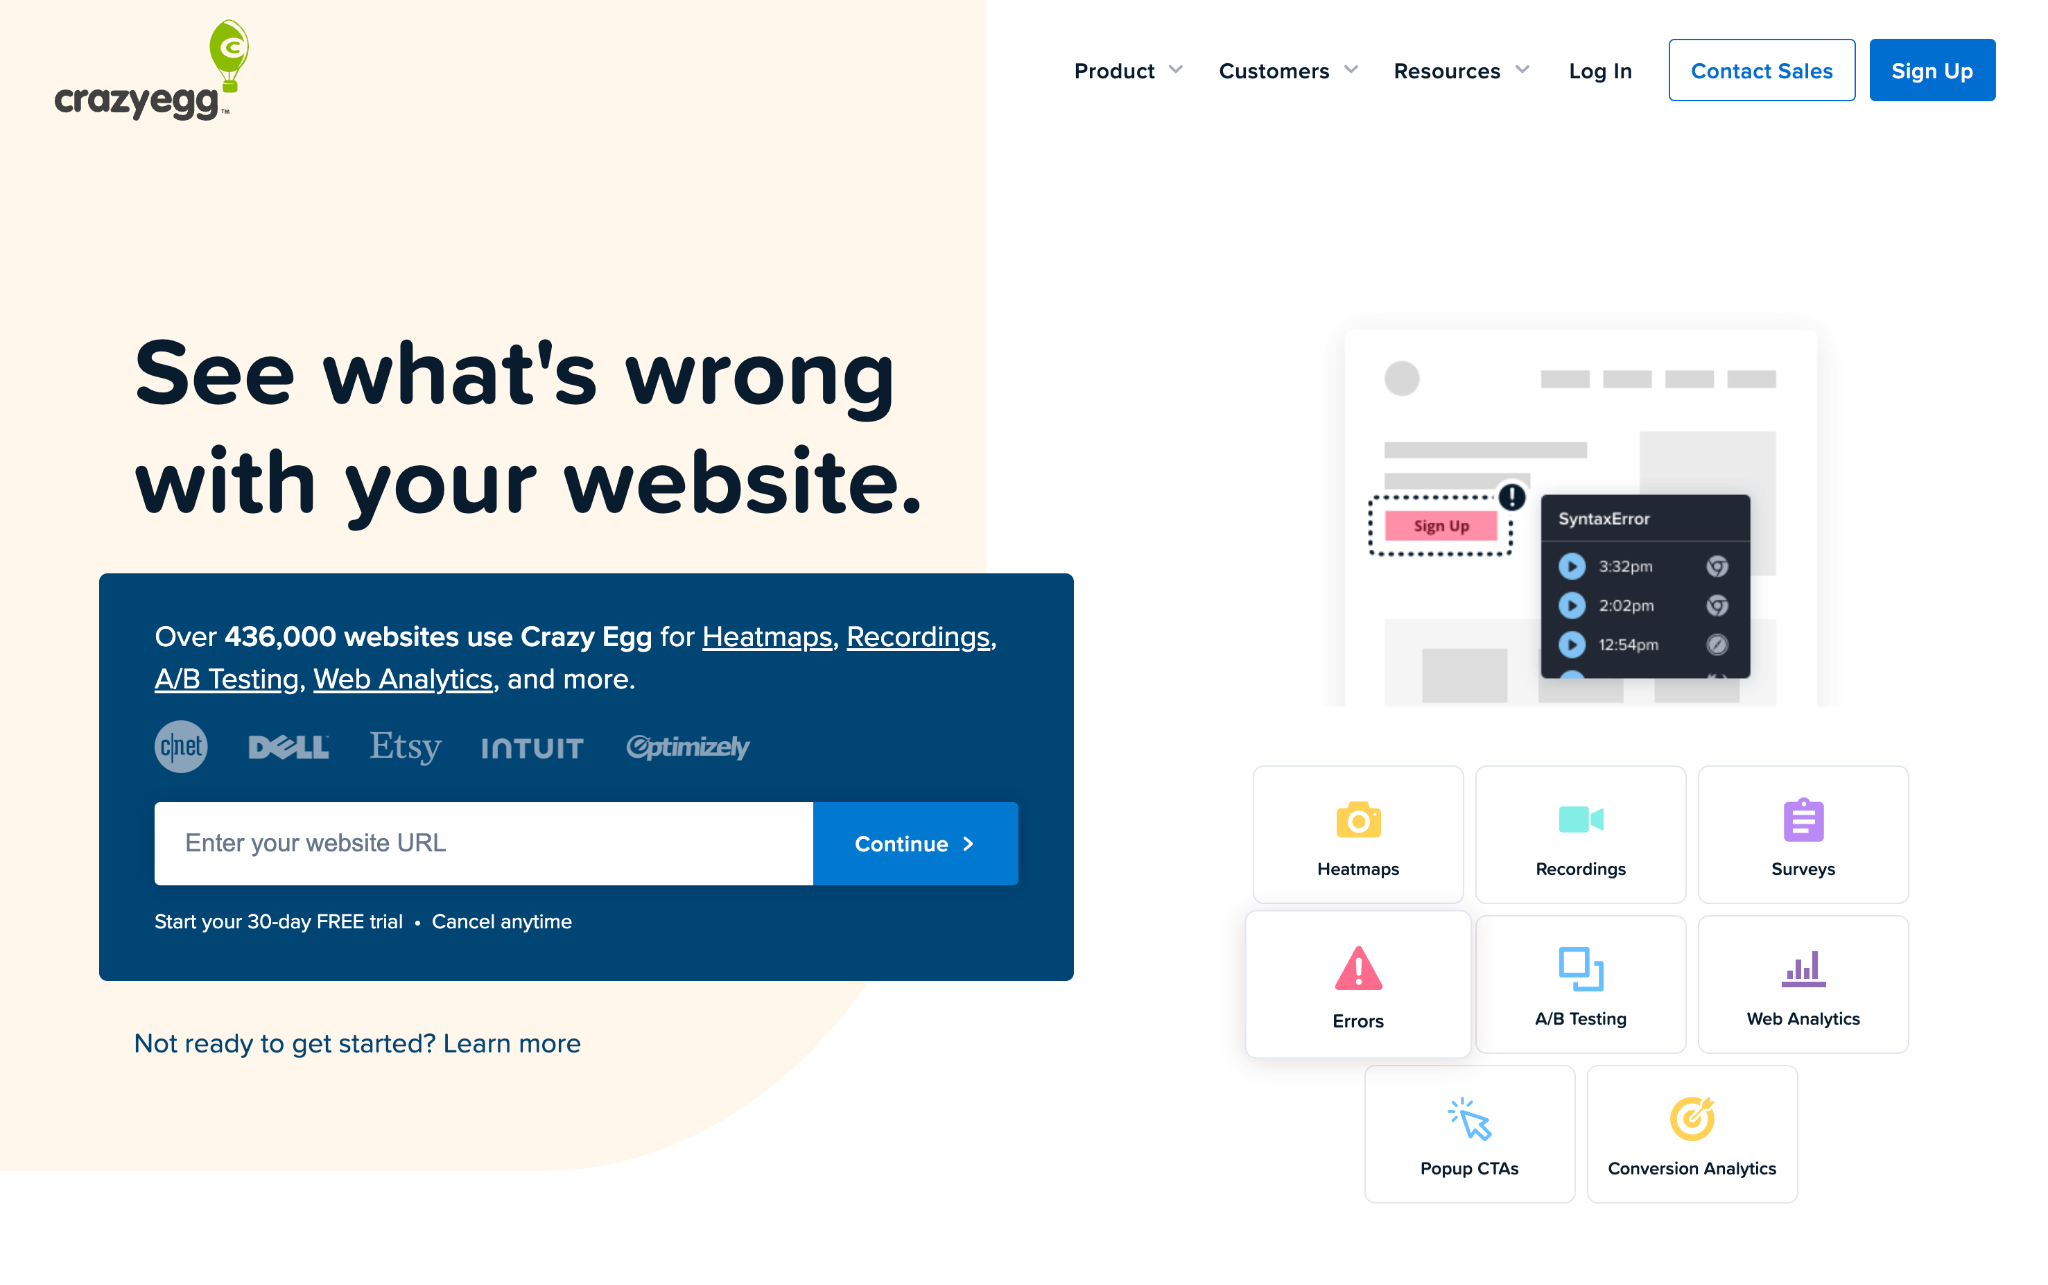
Crazy Egg focuses on heatmaps, session recordings (called recordings/snapshots), A/B testing, and simple conversion optimization tools. It’s popular with merchants who want a clean, easy-to-use visual heatmap and snapshot experience plus basic A/B testing without an enterprise price tag. Crazy Egg plans are based on pageviews tracked and generally start in the low-to-mid tens per month, with higher tiers for larger traffic sites. For merchants running iterative UX or landing-page tests, Crazy Egg provides a fast feedback loop.
Key features
Pricing:
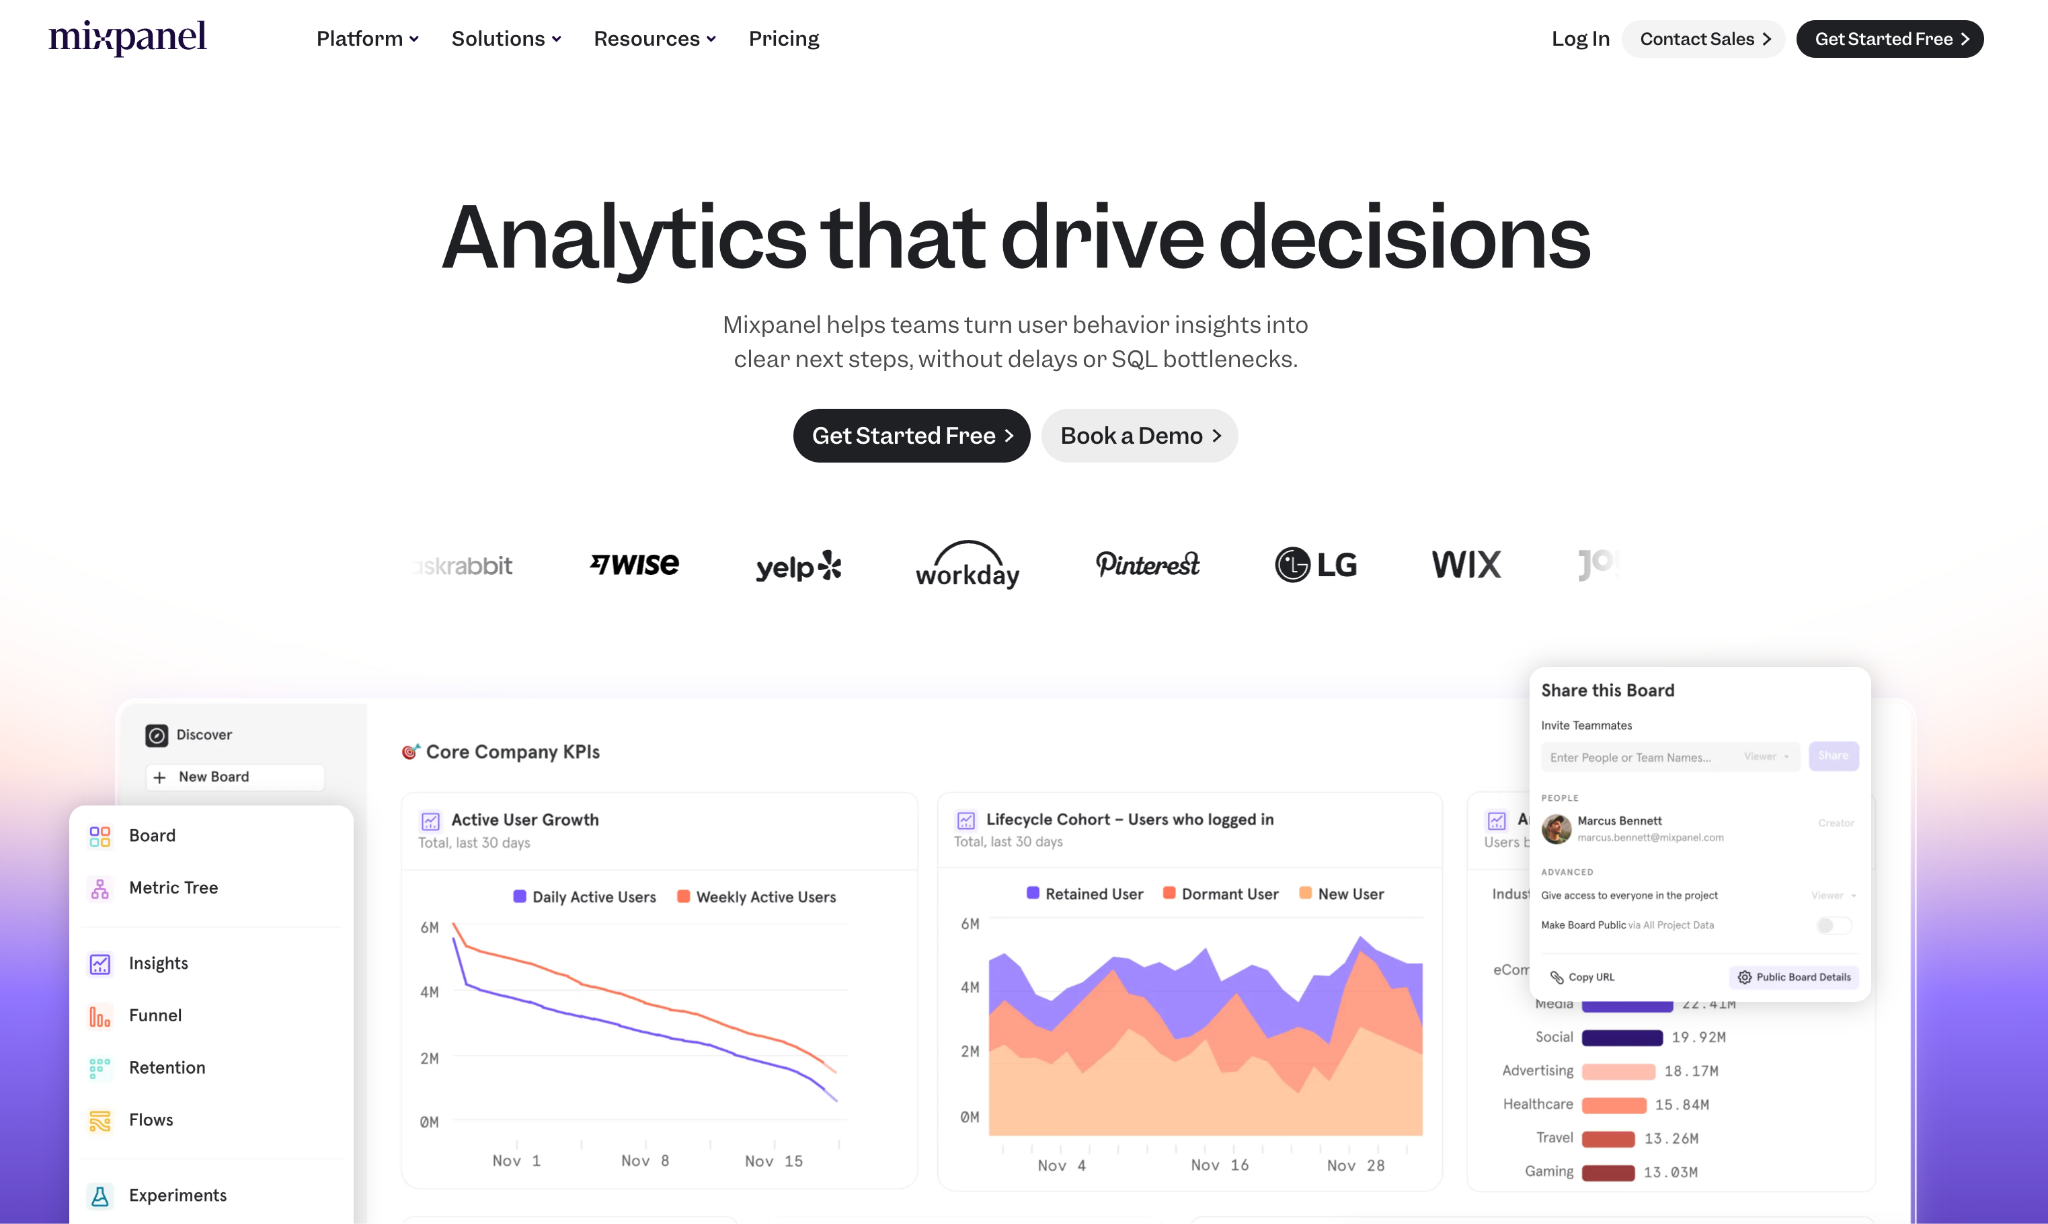
Mixpanel is an event-centric product analytics platform that’s strong for tracking user flows, funnels, retention, and advanced segmentation, great for merchants who want deep, product-style analytics (e.g., feature adoption, behavioral cohorts). It supports large event volumes and has session replay capabilities and dashboards for growth teams. Mixpanel’s free tier is generous (event limits apply), and paid tiers scale by event volume; it’s a good fit when you want granular, queryable event data rather than pageview summaries. If you plan sophisticated behavioral experiments and retention work, Mixpanel is very capable.
Key features
Pricing:
Smartlook combines session recordings, heatmaps, and event-based analytics into one product and supports both web and mobile apps for merchants who want cross-platform behavior insights. It offers a generous free tier and clear upgrade paths for more sessions and retention. Smartlook’s ability to connect recordings to events and funnels helps you validate hypotheses about why conversion steps fail. It’s a solid mid-market option for stores that want replay-driven insights without enterprise complexity.
Key features:
Pricing:
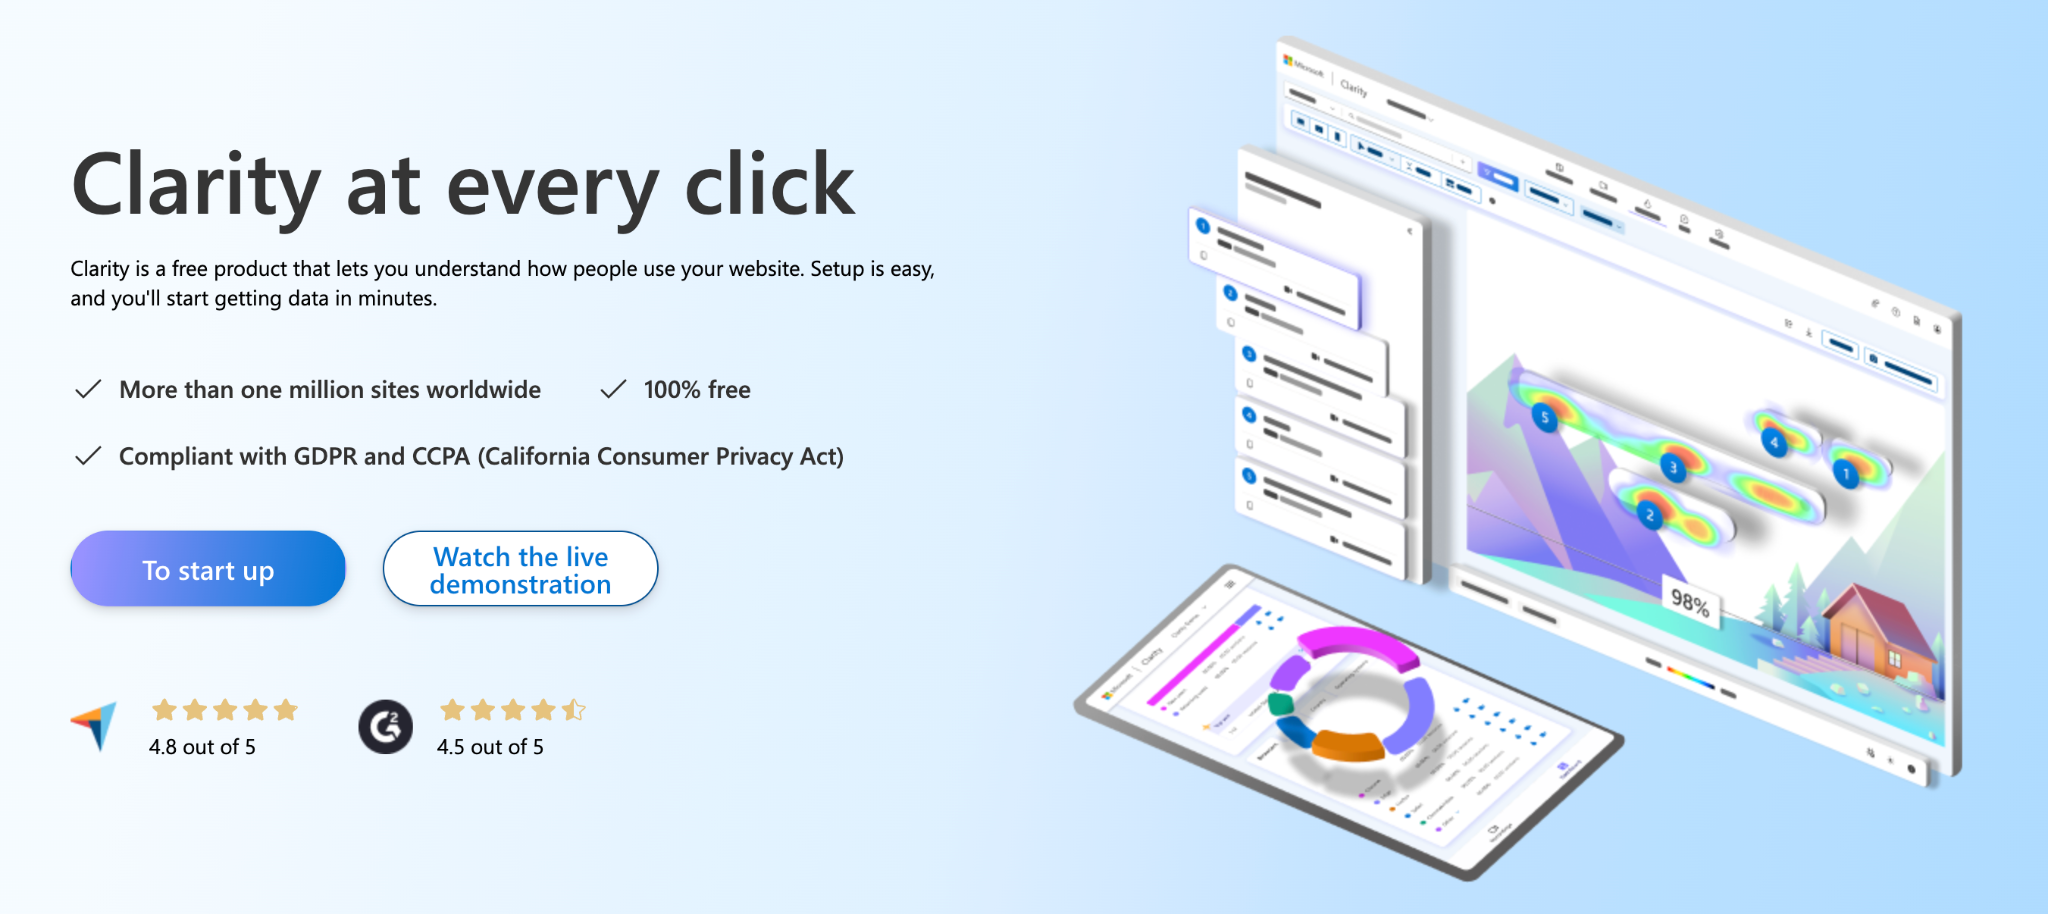
Clarity is a free tool from Microsoft that provides session replays, heatmaps, and helpful behavioral metrics with no traffic caps, a great no-cost way to add qualitative analytics to a Shopify store. It’s easy to install and pairs well with GA4 or Shopify Analytics for a cost-effective stack. Clarity also offers automatic highlighting of “rage clicks” and other frustration signals, making it simple to surface UX issues. For merchants on a tight budget who still want replay and heatmap capabilities, Clarity is hard to beat.
Key features
Pricing:

Amplitude is a product analytics platform oriented toward retention, funnels, and product-led growth metrics, useful when you treat your store like a product and want deep behavior segmentation and lifecycle analysis. Amplitude’s tooling excels at cohort analysis, user journeys, and experimentation tracking. They offer a free starter plan and self-serve plus/enterprise plans that scale with tracked users (MTUs). For merchants focused on advanced growth analytics and lifecycle work, Amplitude is a powerful option (though cost rises with scale).
Key features
Pricing:
Finding the perfect balance of analytics tools depends on your goals, store size, and budget. Start with Shopify Analytics and Google Analytics 4 (GA4) together, they give you a complete picture of your sales performance, customer acquisition, and traffic sources without extra setup costs.
Add Microsoft Clarity for free heatmaps and session replays that provide instant, qualitative insights into how users interact with your store. If you want to go further with feedback and personalization, upgrade to Hotjar, Smartlook, or Lucky Orange to capture on-site surveys, live chat, and conversion funnels.
For advanced analysis and growth-driven metrics, invest in enterprise-grade solutions like Mixpanel, Amplitude, or FullStory. These platforms offer deep event tracking, cohort analysis, and retention measurement, ideal for scaling stores or data-focused teams that want to fine-tune every touchpoint in the customer journey.
When setting up your analytics stack, follow a few essential practices:
Analyzing user behavior on Shopify isn’t just about collecting data, but it’s about understanding the human story behind every click. With the right combination of analytics, replay, and survey tools, you can uncover what motivates your customers, remove friction, and turn insights into measurable results. Whether you’re running a small boutique or a high-volume store, the smartest strategy is to start with simple, layer tools gradually, and let real user behavior guide your optimization decisions.