Please select the platform to login


Comparison tables, whether for pricing plans, product features, or affiliate recommendations, play a crucial role in guiding users toward informed decisions. But designing a comparison table is only half the job. To truly understand how users interact with these tables and which elements influence their behavior, you need a reliable way to track clicks.
Click tracking allows you to identify the exact parts of your table that users engage with most, giving you powerful insights to improve conversions, optimize layout, and refine your value messaging. This guide walks you through everything you need to know about tracking comparison table interactions, explains why it matters, and provides multiple non-technical methods anyone can implement.
Tracking clicks may seem like a technical detail, but it directly influences your ability to improve user experience and drive conversions. Here’s why it is essential:
Every click signals an interest. When users click specific features, tabs, or CTAs inside your table, they reveal what matters most to them. This insight helps you better understand your audience, their priorities, and the decision-making triggers they rely on.
By analyzing these interaction patterns, you can refine your table so it focuses on what users truly value. For example:
In every comparison table, some CTAs perform better than others. By tracking CTA clicks, you can measure:
This helps you adjust the hierarchy of your table and amplify the elements that directly lead to clicks, signups, or purchases.
If users consistently ignore certain interactive elements, like feature toggles, comparison filters, or plan tabs, it may indicate that the design is unclear, the table is too complex, or users don’t find those elements relevant.
Click tracking highlights any friction points. When certain features or layouts receive minimal engagement, you can redesign them to make the comparison easier and more intuitive.
Conversion optimization isn’t guesswork, it’s data-driven. Your comparison table plays a central role in product selection and purchase decisions, so optimizing it brings direct revenue benefits.
Click tracking allows you to:
In other words, tracking turns your comparison table into a measurable, optimizable conversion asset instead of a static display.
Not all clicks are equal. To fully understand how users engage with your comparison table, you should track a variety of event types. Each one reveals a different layer of user intent and decision-making behavior.
Below are the key event categories worth monitoring:
Many comparison tables allow users to interact with different columns, such as Basic, Pro, or Enterprise. Tracking these interactions shows which plan captures the most curiosity even before users click a CTA.
For example:
Understanding plan selection patterns helps you adjust pricing, messaging, and feature distribution.
Some tables include expandable rows, tooltips, or info icons to reveal additional details. These micro-interactions offer deep insight into what users care about most.
This includes clicks on:
If users frequently explore certain features, you can highlight them visually or mention them earlier in your product copy.
For more advanced comparison tables, users may sort by:
Tracking these actions helps you understand how users evaluate options and what criteria they value most when comparing products.
If sorting by price is consistently popular, for example, you may choose to emphasize cost savings or discounts.
These clicks matter the most because they reflect conversion intent. Common CTAs include:
Tracking these clicks shows:
This information is crucial for improving conversion rates and informing your offer strategy.
If your comparison table sends users to external product pages (such as Amazon or partner websites), tracking outbound link clicks is essential for:
Outbound click tracking helps you understand which products get the most interest and whether your table design influences affiliate click-through rates.

Google Tag Manager (GTM) is the most flexible, user-friendly, and scalable tool for tracking comparison table clicks, without needing to modify code. It allows you to set up triggers and events based on user behavior and automatically send all data into Google Analytics 4 (GA4).
Here’s a deeper, more detailed breakdown:
Before GTM can detect and categorize clicks, you must enable the relevant variables. These variables help GTM understand what users click and allow you to target specific table elements later.
Key variables include:
These variables give GTM the context needed to identify a button, a cell, a link, or a tab within your table.
Once enabled, GTM will be able to “listen” for clicks throughout your table and distinguish between different elements.
Triggers tell GTM when to fire an event. Since comparison tables include many clickable parts, you can create triggers based on various criteria.
Three useful trigger styles include:
Many websites label CTA buttons or feature toggles with specific CSS classes. You can configure GTM to fire an event whenever a user clicks an element that contains your selected class.
This is especially useful when:
If each element or CTA button in your table has a unique ID (for example, “plan-basic,” “plan-pro”), you can set up highly specific triggers.
This method is great for:
If your buttons share the same wording (e.g., “Buy Now”), you can trigger events based on the text users click.
This option works well when:
Set up triggers for each relevant table action to capture the full click journey.
Once your trigger is created, you need to create a tag that sends the click event to GA4.
This is where you name your event and attach information (called parameters) that describe the interaction. For example:
Adding detailed parameters allows GA4 to categorize and filter your data more effectively. The more context you include, the easier it becomes to analyze user behavior later.
Before pushing live changes, preview your setup inside GTM. This step ensures:
Once you confirm that tracking works properly, publish your container so the tracking becomes active for all website visitors.
Your table will be easier to track if elements have predictable labels:
This improves the accuracy of your analytics.
Don’t limit tracking to CTA buttons. Include:
Together, these reveal the full decision-making journey.
In analytics platforms, detailed attributes make analysis easier. Always send contextual data such as:
This helps you understand not just what users clicked but why they clicked it.
If users interact with the table but don’t click a CTA, it may indicate:
Understanding drop-off helps you refine your messaging and improve clarity.
Once you know which areas of your table users interact with most, conduct A/B tests for:
Use your click tracking insights to test layout improvements strategically.
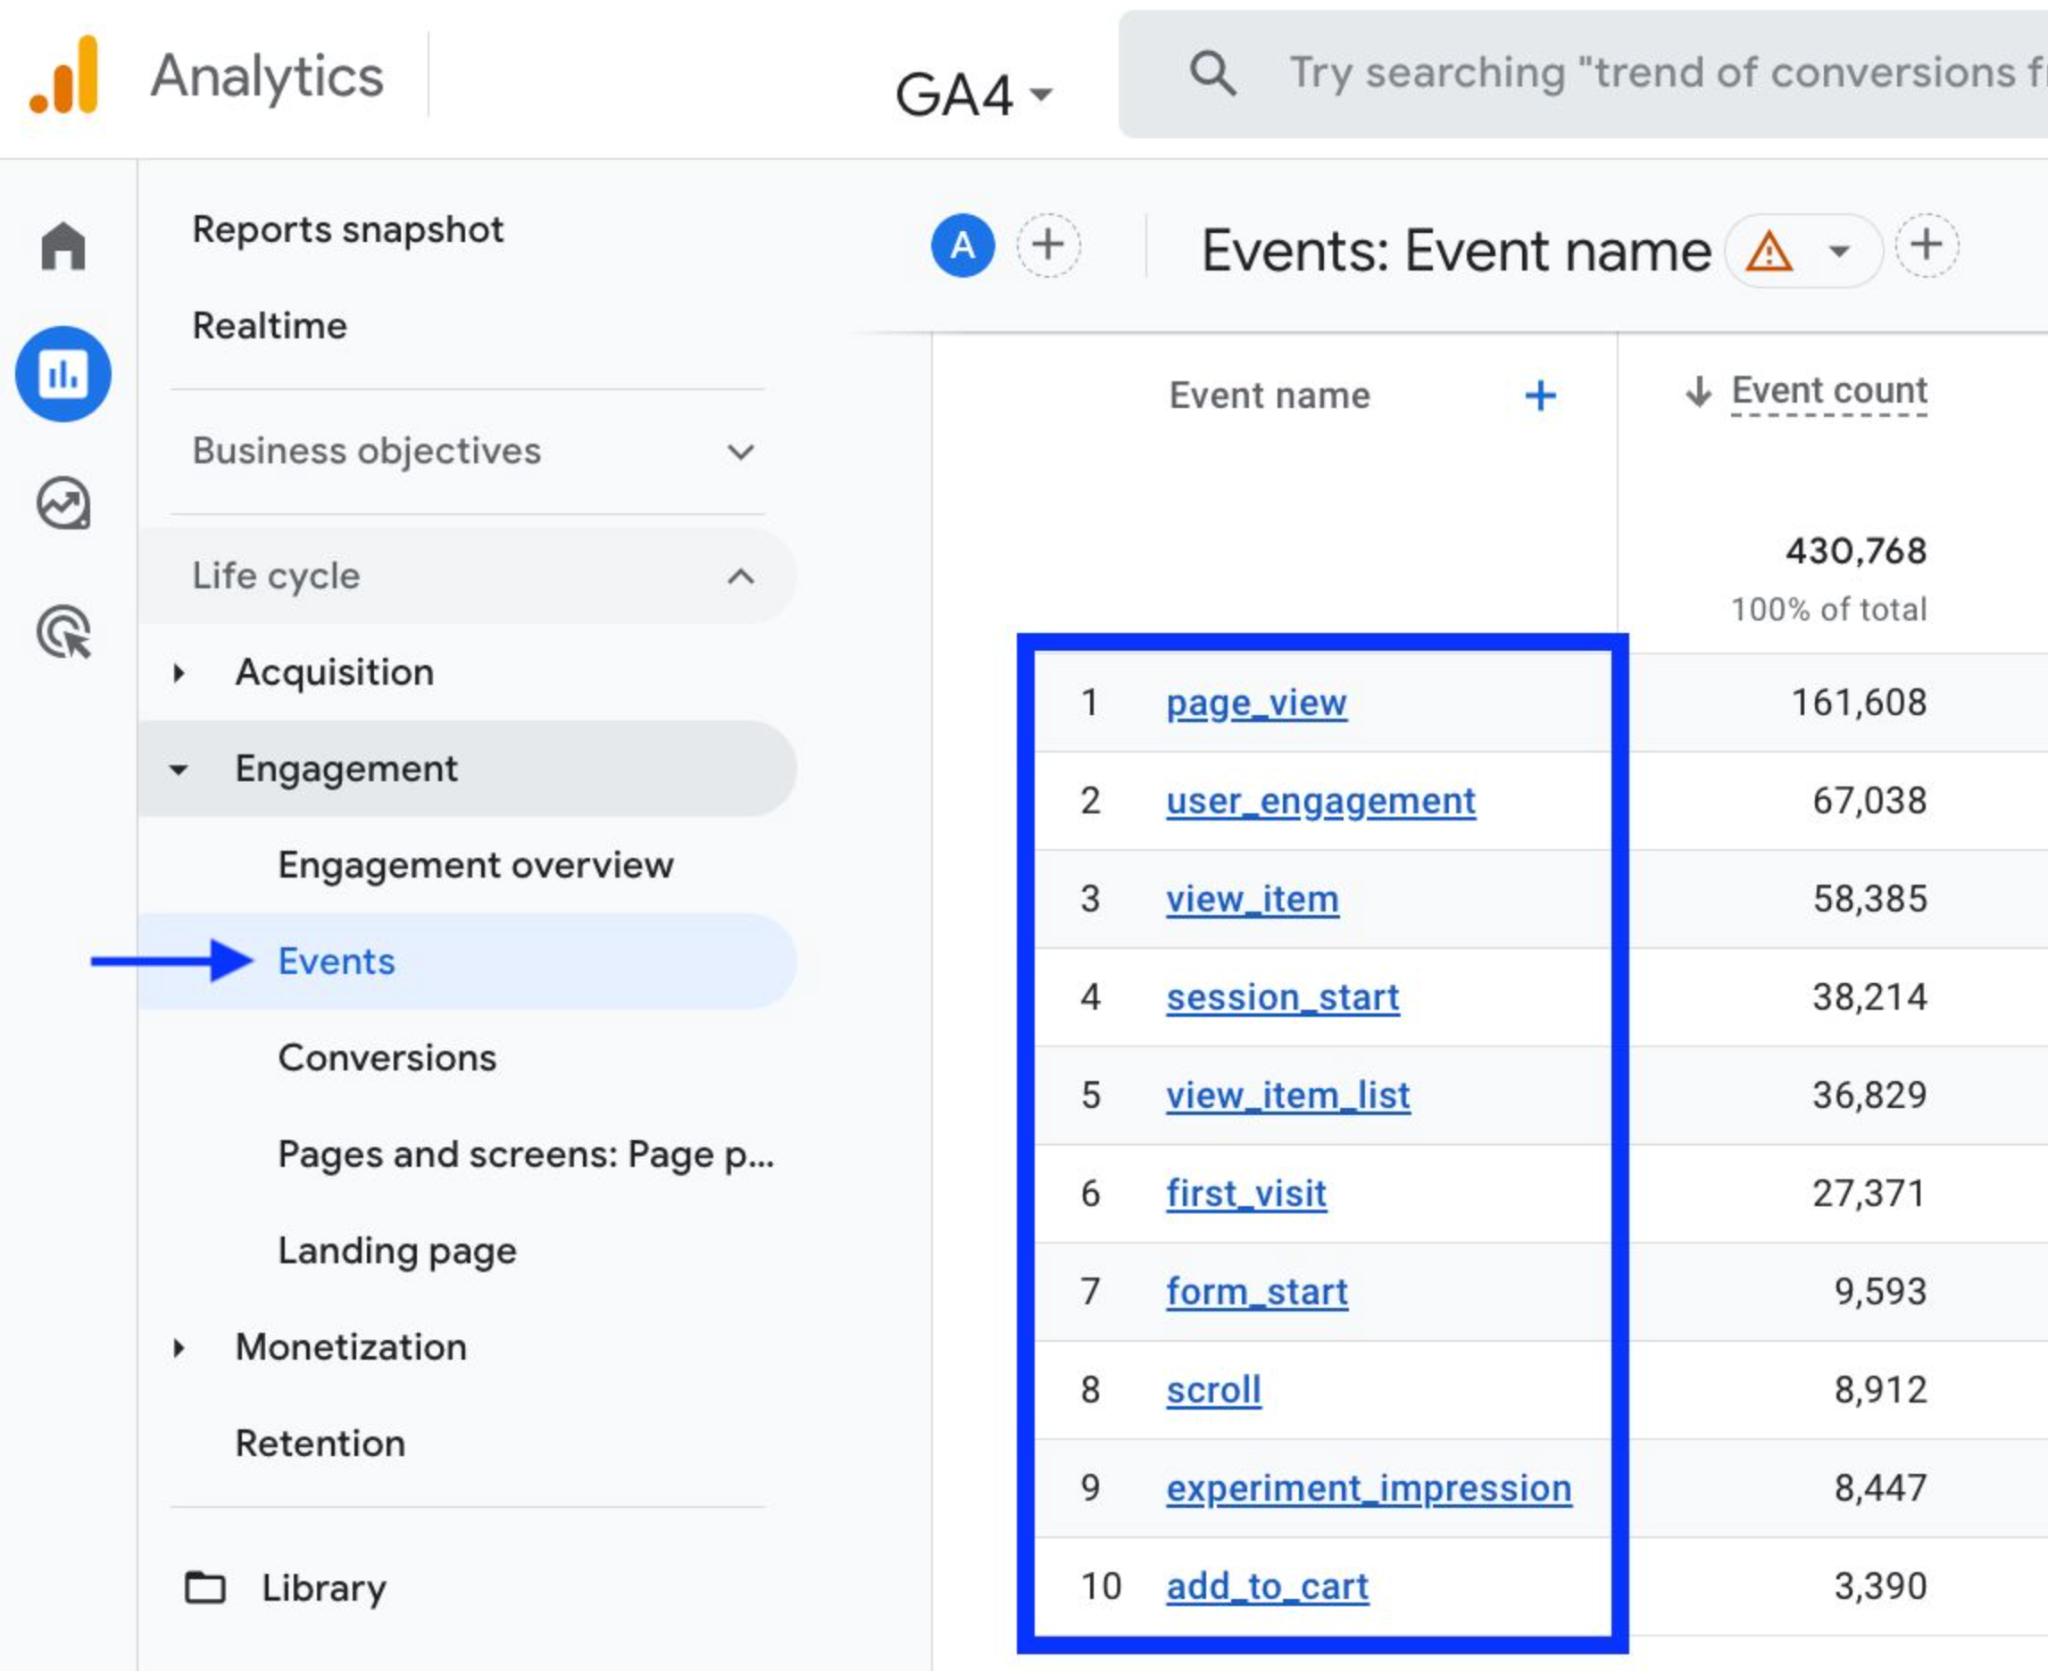
Once events start tracking, GA4 gives you multiple locations to analyze results.
This section shows all tracked events and their frequency.
Here, you can create custom reports to compare:
This level of insight helps you make confident design and messaging decisions.
Tracking clicks on comparison table elements is one of the most effective ways to optimize user experience and improve conversion rates. Whether you are running a pricing page, offering product comparisons, or managing affiliate lists, click interaction data tells you exactly how users think, compare, and choose.
By using analytics tools like GTM and GA4, without needing to write any code, you can track interactions across tabs, features, filters, and CTAs with precision. This data then becomes the foundation for smarter design decisions, stronger messaging, and more effective conversion strategies.