Please select the platform to login


Conversion Rate Optimization (CRO) is often described as a data-driven discipline, yet many optimization decisions are still guided by oversimplified interpretations of metrics. Numbers feel objective and reassuring, but without context, they can quietly distort reality. A metric moving “in the right direction” does not automatically mean the user experience has improved, or that the business is healthier.
In practice, CRO fails not because teams track the wrong metrics, but because they draw the wrong conclusions from the right data. To avoid false positives, misleading wins, and costly redesigns, it’s crucial to understand what these metrics can and cannot tell you.
Below are nine CRO metrics marketers frequently misinterpret, explained in depth, with guidance on how to read each one more accurately and strategically.

Conversion rate is often treated as the ultimate CRO scorecard. If it increases, teams assume the experiment worked. If it drops, alarms go off. However, conversion rate is a ratio, not a value metric, which means it can improve even when overall performance declines.
For example, narrowing your traffic sources or removing high-priced products can increase conversion rate simply because fewer users are exposed to harder decisions. Similarly, heavy discounts may boost conversions while quietly eroding profit margins. In these cases, the metric improves, but the business outcome does not.
Because of this, conversion rate alone rarely reflects true optimization success. It tells you how often users convert, but not whether those conversions are valuable or sustainable.
How to read it correctly: Conversion rate should always be interpreted alongside revenue per visitor, average order value, and traffic quality. A healthy CRO strategy focuses on efficient growth, not just higher percentages.
Bounce rate is commonly viewed as a signal of poor engagement, users land, dislike what they see, and leave. While that can be true in some cases, bounce rate is often misunderstood because it ignores user intent.
A visitor might bounce because they quickly found an answer, copied contact information, or completed their task without needing another page. This is especially common on landing pages, blog posts, FAQs, and support content. In these scenarios, a bounce can actually represent a successful visit.
The danger comes from treating all bounces as negative without understanding why users left or what they accomplished before doing so.
How to read it correctly: Instead of evaluating bounce rate in isolation, combine it with time on page, scroll depth, and engagement events. A fast bounce may indicate friction, while a long, engaged bounce may indicate satisfaction.
Average Order Value is often used to measure monetization efficiency, and increasing AOV is a common CRO goal. However, a higher AOV does not automatically mean a better buying experience.
Upsells, bundles, and minimum thresholds can push users to spend more, but they can also introduce hesitation, increase decision fatigue, or discourage first-time buyers. In some cases, AOV rises because fewer people complete checkout, leaving only high-intent buyers behind.
When viewed alone, AOV can give a false sense of improvement while masking declining conversion rates or reduced purchase frequency.
How to read it correctly: Evaluate AOV together with conversion rate, total orders, and customer lifetime value. Strong CRO balances order size with ease, trust, and long-term retention, not just higher cart totals.
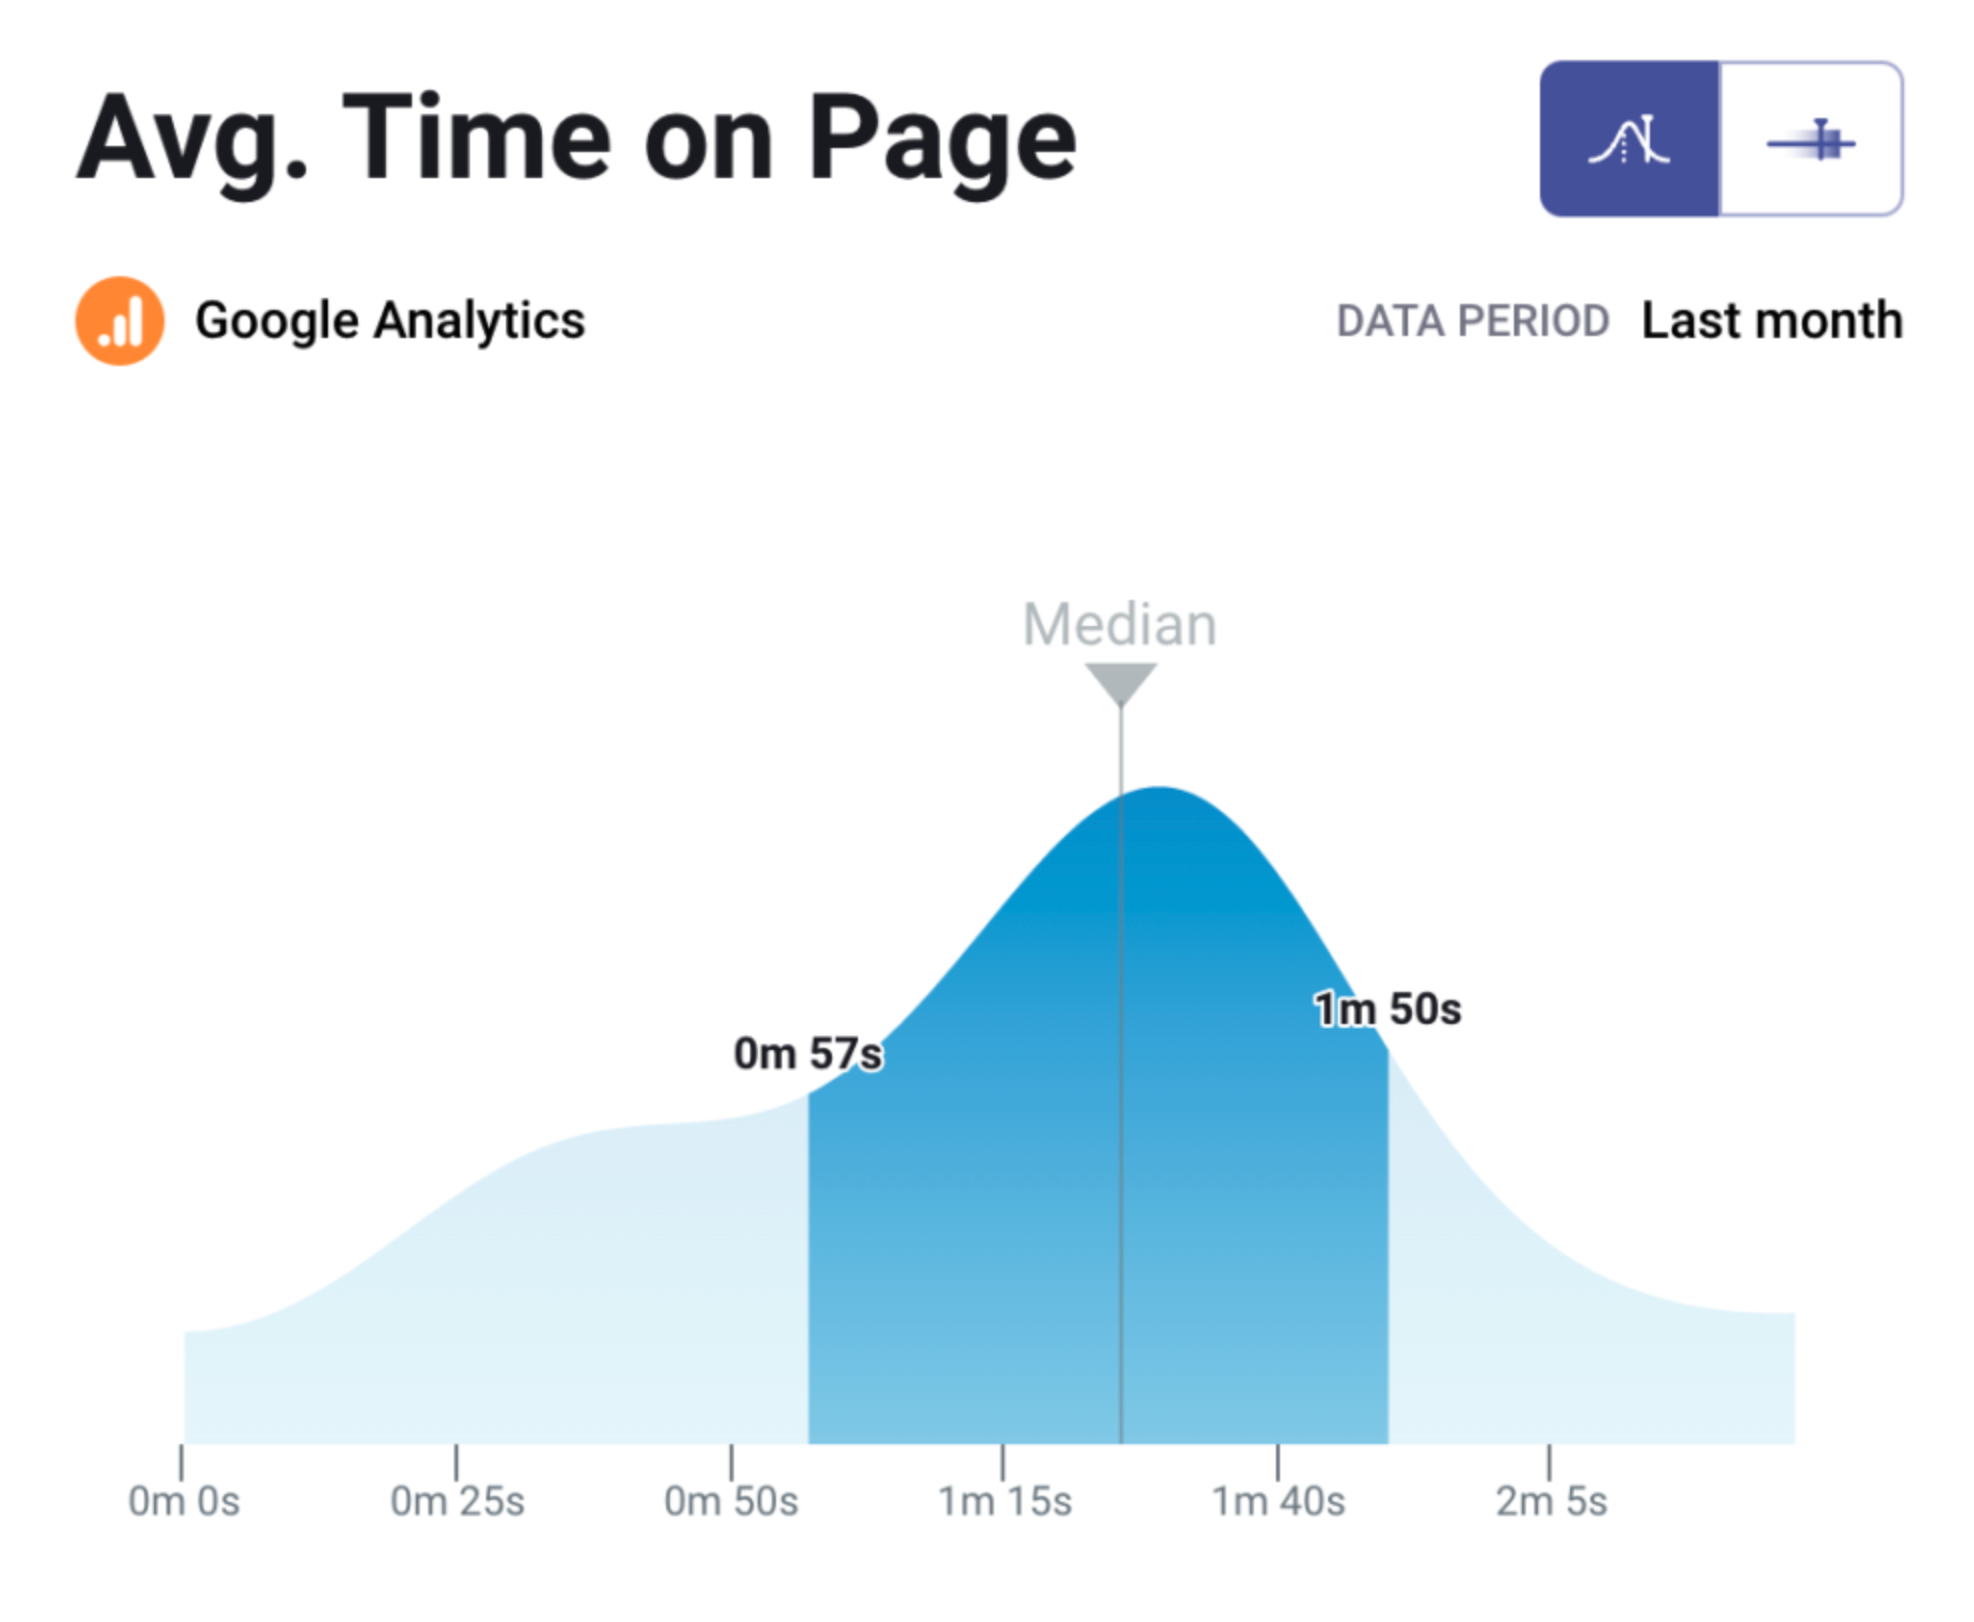
Time on page is often interpreted as a proxy for engagement, the longer users stay, the more interested they must be. However, in CRO, time can also represent confusion, friction, or indecision.
Users may spend extra time because they’re struggling to understand pricing, comparing options, or searching for missing information. On transactional pages, longer sessions often correlate with lower confidence, not higher intent.
As a result, time on a page can mean very different things depending on the page’s purpose.
How to read it correctly: Always judge time on page against the page goal. Educational content benefits from longer engagement, while product, checkout, and signup pages often perform better when users move quickly and decisively.
Click-through rate is widely used to measure CTA effectiveness, but clicks alone do not equal progress. A high CTR can sometimes indicate curiosity rather than genuine intent.
Buttons with vague copy, aggressive styling, or misleading promises may generate clicks, but if users abandon immediately afterward, the click becomes a dead end rather than a step forward. In these cases, CTR increases while conversions stagnate.
This disconnect often happens when expectations set by the CTA don’t match the experience that follows.
How to read it correctly: CTR should be evaluated alongside post-click behavior, such as bounce rate, time on destination page, and completion rate. True CRO success comes from aligned expectations, not just higher click volume.
Exit rate frequently becomes a scapegoat metric, if users leave on a page, that page must be failing. In reality, every user journey must end somewhere, and not all exits indicate friction.
Thank-you pages, order confirmations, and final informational pages naturally have high exit rates. Even product pages can see high exits during comparison shopping or research phases.
The real issue isn’t exits themselves, but exits that interrupt critical actions.
How to read it correctly: Focus on whether exits happen before or after key conversion steps. If users exit before adding to cart or submitting forms, investigate friction. If exits occur after completion, the page may be doing its job perfectly.

Cart abandonment is often treated as a checkout failure, but many users abandon carts intentionally as part of their decision process.
Shoppers may be comparing prices, saving items for later, waiting for discounts, or browsing on mobile with the intent to purchase later on desktop. Viewing all abandonment as lost revenue oversimplifies complex buyer behavior.
This is why aggressive checkout changes based solely on abandonment rates can sometimes do more harm than good.
How to read it correctly: Segment abandonment by device, traffic source, and user type. Use cart abandonment data to inform recovery strategies, such as reminders or reassurance, not to assume universal checkout failure.
Increasing traffic is often celebrated as a win, but traffic alone does not equal CRO success. In fact, higher traffic can amplify existing conversion problems.
If messaging is unclear or value propositions are weak, more visitors simply mean more people experiencing friction. This often leads to disappointing results despite strong acquisition efforts.
CRO is fundamentally about making each visit more effective, not just increasing the number of visits.
How to read it correctly: Shift focus from raw traffic numbers to revenue per visitor and conversion rate by channel. Smaller, high-intent audiences frequently outperform large volumes of low-quality traffic.
A/B test winners are often implemented quickly once statistical significance is reached. However, not every winning variation represents a healthy long-term improvement.
Some tests win by creating urgency, pressure, or fear of missing out. While these tactics can increase short-term conversions, they may also increase refunds, reduce trust, or harm brand perception over time.
True CRO success considers what happens after the conversion, not just the moment it occurs.
How to read it correctly: Validate test results over longer periods and monitor downstream metrics such as retention, repeat purchases, and support requests. A real winner improves both user experience and business sustainability.
CRO metrics are not inherently misleading; they become problematic when treated as absolute truths instead of directional signals. Each metric captures only one slice of user behavior, and no single number can explain the full experience.
The most effective CRO teams move beyond surface-level wins and ask deeper questions: Why did this change happen? Who did it help? And what trade-offs did it introduce? When metrics are interpreted with context, intent, and long-term thinking, optimization stops being reactive and becomes truly strategic.